Historical Transmission Costs
Capacity I AD Hub Pricing I Historical Spot REC Prices I Historical LMP Prices
What are transmission costs?
In addition to energy supply, capacity and other charges, your energy bill also includes transmission costs. Transmission costs are charges from your local utility for moving a vast amount of electricity from generating power plants to utility substations.
In some utilities, these rates are set and fixed annually by your local utility and are based on your organization’s Network Service Peak Load Contribution (NSPL), which is set annually and is based on your energy usage during peak hours. Network Integrated Transmission Service (NITS) is also factored into your transmission cost, which is specific to your respective utility and may or may not change every year on June 1.
Can I reduce my transmission costs?
You can lower your transmission costs for next year by reducing your usage during high peak times in 2024, which happens only a few hours a year. You can take control of your demand costs with AEP Energy’s complimentary PeakAdvisory® program where you’ll receive notifications during high-demand days alerting you to reduce your energy usage. 1 Learn more about our demand management programs.
The graph below highlights historical transmission rates from various utilities within the PJM and MISO system areas.
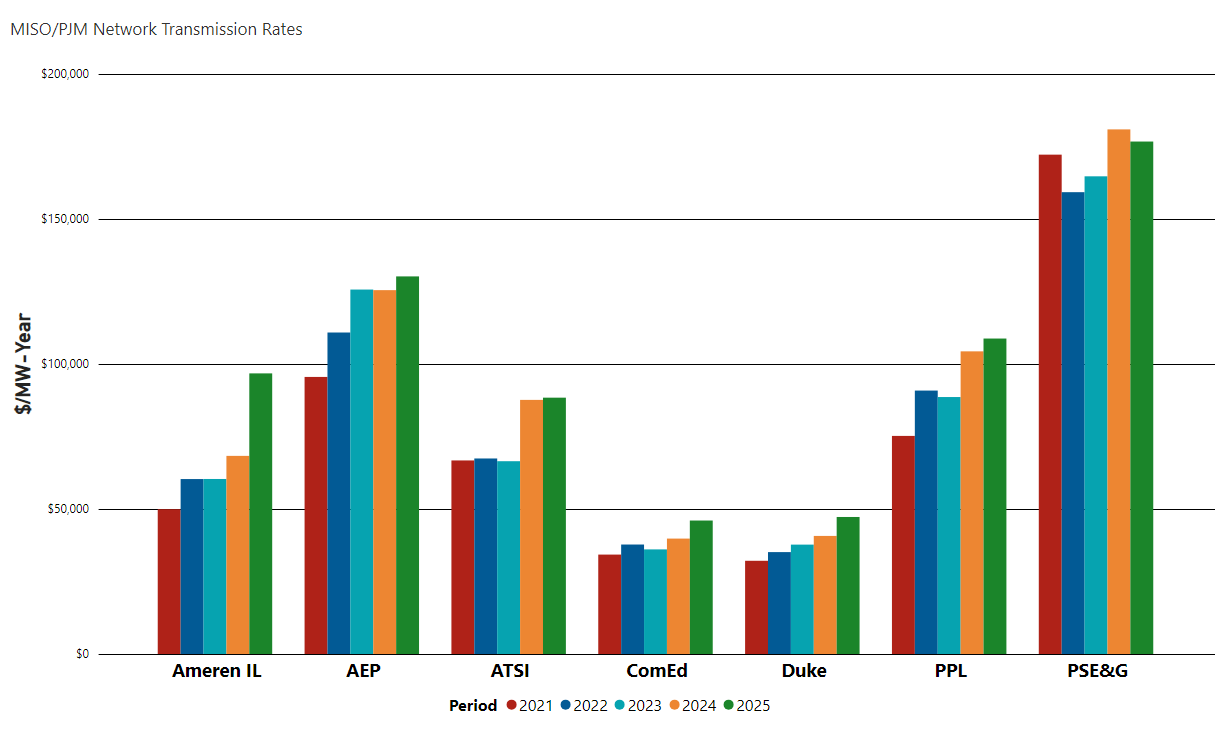
Source: PJM, PJM – network-integration-trans-service-january-2023.ashx (pjm.com)
PJM Transmission Network Service Peak Load Contribution (NSPL) Time Periods
Sources:
PJM – Billing, Settlements & Credit
-
Time Period Date Load (MW) Hour Ending Nov 1 - Oct 31 2025-06-24 2709.1 19:00 -
Time Period Date Load (MW) Hour Ending Nov 1 - Oct 31 2025-01-22 23725.6 08:00 -
Time Period Date Load (MW) Hour Ending Nov 1 - Oct 31 2025-01-22 9791.6 08:00 -
Time Period Date Load (MW) Hour Ending Nov 1 - Oct 31 2025-06-24 12659.7 16:00 -
Time Period Date Load (MW) Hour Ending Nov 1 - Oct 31 2025-06-23 6584.9 19:00 -
Time Period Date Load (MW) Hour Ending Nov 1 - Oct 31 2025-06-23 20713.7 18:00
-
Time Period Date Load (MW) Hour Ending Nov 1 - Oct 31 2025-07-24 3396.3 18:00 -
Time Period Date Load (MW) Hour Ending Nov 1 - Oct 31 2025-07-24 5189.9 18:00 -
Time Period Date Load (MW) Hour Ending Nov 1 - Oct 31 2025-06-24 4198.4 18:00 -
Time Period Date Load (MW) Hour Ending Nov 1 - Oct 31 2025-06-23 2694.5 18:00 -
Time Period Date Load (MW) Hour Ending Nov 1 - Oct 31 2025-06-24 6273.4 18:00 -
Time Period Date Load (MW) Hour Ending Nov 1 - Oct 31 2025-06-24 2999.9 19:00 -
Time Period Date Load (MW) Hour Ending Nov 1 - Oct 31 2025-06-24 8379.5 18:00 -
Time Period Date Load (MW) Hour Ending Nov 1 - Oct 31 2025-01-22 2908.6 09:00 -
Time Period Date Load (MW) Hour Ending Nov 1 - Oct 31 2025-06-24 6015.5 18:00 -
Time Period Date Load (MW) Hour Ending Nov 1 - Oct 31 2025-01-22 8057.0 09:00 -
Time Period Date Load (MW) Hour Ending Nov 1 - Oct 31 2025-06-24 10229.5 19:00
1PeakAdvisory program is not applicable for customers in AEP Ohio, AES Ohio, Duke Energy and First Energy utilities.
AEP Energy is a competitive retail electric service provider generation supplier and a competitive retail natural gas service provider supplier and an affiliate of Ohio Power Company (AEP Ohio). AEP Energy is not soliciting on behalf of, endorsed by, acting on behalf of, and is not an agent of AEP Ohio, your electric or gas distribution company, any governmental body, or consumer group. AEP Energy does not guarantee the accuracy, timeliness, suitability, completeness, freedom from error, or value of any information herein. The information presented is provided “as is”, “as available”, and for informational purposes only, speaks only to events or circumstances on or before the date it is presented, and should not be construed as advice, a recommendation, or a guarantee of future results. AEP Energy disclaims any and all liabilities and warranties related hereto, including any obligation to update or correct the information herein.
Copyright © AEP Energy, Inc. All Rights Reserved.