Why is Natural Gas Pricing So High? The Current State of the Market
CommercialNov 8, 2021
Over the last several months, the natural gas market has been on a very strong upward pricing trend. In this edition of Customer Insights, we’re going to take a look at some of the factors causing the prices in the market to increase so quickly, examine the difference between the market move now versus a price spike from a storm like Winter Storm Uri, and evaluate if this price level is the new norm for natural gas. In order to understand what’s currently happening in the market, we’re going to cover some natural gas basics. The natural gas market runs in two general cycles: April through October is considered the injection season and November through March is considered the withdrawal season. In this article, we are going to be focusing on the NYMEX natural gas product and how it moves between those seasons. First let’s start with some general market definitions.
Definitions
Physical natural gas products – these are natural gas products that are bought or sold where the transaction results in an actual delivery of natural gas at the designated location that is bought or sold.
Financial natural gas products – these natural gas products are bought or sold where the transaction results in a financial exchange based on a differential of the market price to the transaction price on a set date of settlement. No physical delivery happens with financial transactions.
Futures natural gas products – these are natural gas products that are bought or sold for a set time period in the future. These can be financial or physical products that can have time ranges spanning from one day to years.
Prompt month – this refers to the futures contract that is nearest to expiration and usually refers to the next calendar month. Also known as front month.
NYMEX – a financial natural gas product that trades based off of futures pricing at a location in Louisiana called the Henry Hub. This location was chosen to be the NYMEX product due to its location with multiple pipeline interconnects and its large liquidity in trading. It was deemed to be a good representation of the state of pricing across the market.
MMBtu – this is one of several standard measurements for natural gas. A British Thermal Unit (Btu) is a measurement of the quality of energy output from natural gas at a certain temperature and pressure. MMBtu is one million British thermal units.
Bcf – this is one of several standard measurements for natural gas, it stands for billion cubic feet. One billion cubic feet is equivalent to one million MMBtu.
LNG – this stands for Liquified Natural Gas, which is natural gas that has been cooled into a liquid form at a set temperature.
Factors Driving the Current Market
So what’s causing the current state of market prices? Let’s explore the factors driving the market and how they significantly impact today’s natural gas prices.
1) Production – The domestic natural gas market is holding steady at around 93 billion cubic feet per day. Despite all of the market fluctuation, that number has stayed relatively constant and doesn’t have any indication of increasing to account for higher pricing. Most of the producers in the market are using the higher prices as a way to pay down debt instead of spending it on ramping up production or doing more exploratory drilling. This means the market has signaled that even if prices run higher, producers won’t bring more natural gas online.
2) LNG Demand – The global market has created a huge demand for LNG. Natural gas prices in Europe and Asia are averaging well over $25/MMBtu and have spiked at over $50/MMBtu. These areas don’t have nearly the gas supply that the United States does; however they have increased their natural gas usage as a way to retire older and less environmentally-friendly sources like power plants that run on coal or nuclear power. This demand is creating a favorable spread of the price to liquefy natural gas domestically and export it to these markets. That means there is a constant demand from LNG producers to purchase natural gas and liquefy it. However, there is only so much LNG that can be exported, regardless of what pricing does overseas. Of the 93 Bcf per day we produce, LNG exports are currently averaging close to 10 Bcf per day and max out around 12 Bcf per day. There is a limit in how much our infrastructure can actually produce and then line up shipping to get it overseas, so this isn’t the whole story.
3) Storage – The U.S. tracks its overall storage levels each week. We have been running at a deficit to our 5-year average levels as well as a large deficit to our position one year ago. A lot of factors come into play with the overall levels we put into storage nationwide, however we have been consistently under injecting compared to previous years. Storage has been trying to catch up these last few weeks on the heels of some milder weather, however it’s still under the 5-year average and well under where we were last year.
4) Weather – Weather is probably the biggest single driver of gas prices in the winter, however it has also had a large impact this summer as well. When we have extended periods of hot, record-setting weather that translates into more power usage for air conditioning and cooling processes. This increased demand for power is fueled by power plants that operate on natural gas. This constant demand by power plants creates another area of demand for natural gas that has been very strong this season. There has also been an extremely high wildfire season on the west coast driven by an ongoing drought. The drought is also impacting hydro-electric generation, which is putting a heavier reliance on natural gas generation. This is helping prices climb and has made the west coast the most expensive natural gas market in the country over the summer.
5) Hurricanes – While technically part of the weather, hurricanes deserve their own designation here. If a large hurricane approaches oil-producing areas like the Gulf of Mexico, it can wreak havoc. They can take oil rigs completely offline for an extended period of time with sometimes catastrophic damage that takes an extended period of time to repair. Hurricane Ida made landfall in Louisiana in August 2021 as a category four hurricane a little over a month ago. That caused major damage to numerous production rigs that are still trying to get back online. This has caused less oil and natural gas production than expected, which has contributed to the supply and demand increase in prices we have seen.
6) Pipeline Maintenance and Outages – Pipelines are the main infrastructure in which we move natural gas from production regions to consumption regions across the country. During the months of April through October, the demand to use pipelines is lower than it is from November through March. Knowing this, the companies that own and operate the pipelines will do annual maintenance and plan updates to their system during the less busy season. This causes bottlenecks when we still have high demand during these off seasons (think of this like a traffic jam when they shut down half of the lanes on the freeway). With less overall capacity to move natural gas due to the planned and unplanned outages that happen from this work, this has put another stress point on the market.
Differences Between the Current Market and a Weather Event Like Winter Storm Uri
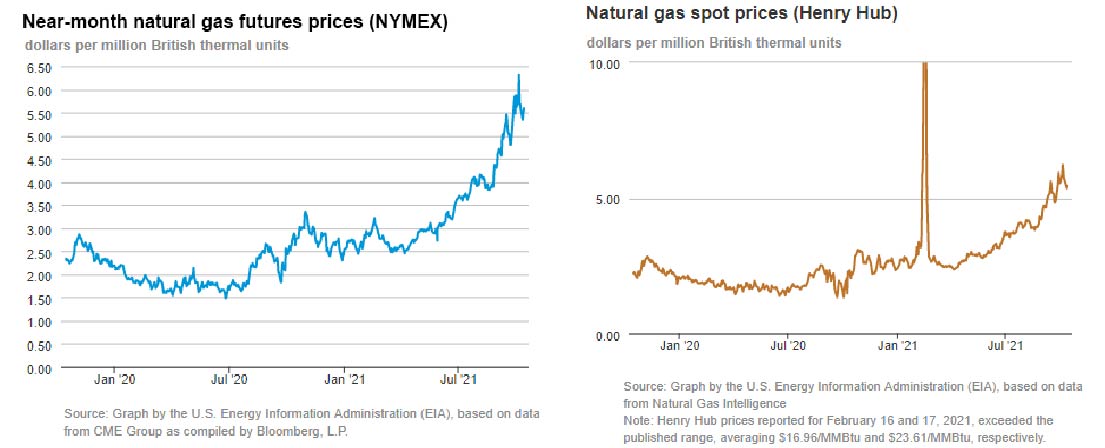
Winter Storm Uri caused all kinds of energy supply issues nationwide as it passed through last February. I am based in Houston and at my house we lost power for three days due to the freezing weather. That storm caused spot prices to soar across the nation due to higher heating demand from the cold weather, generation shutting down that wasn’t winterized (especially in Texas) and an overall lack of communication through the market of what was working and what wasn’t. While Uri caused a huge amount of damage and billions of dollars in pricing swings, it was an isolated event that only lasted about a week. The main difference in what we are seeing now versus a storm like Uri is the overall timeline of inflated prices. While the current market is nowhere near what the daily price for natural gas was during Uri, the prices we see are extended all the way out into the winter of November 2022 to March 2023 with an extreme focus on this winter.
Exhibit 1
Source: U.S. Energy Information Administration (EIA) (Oct. 14, 2021)
Is This the New Norm for Gas Prices Going Forward?
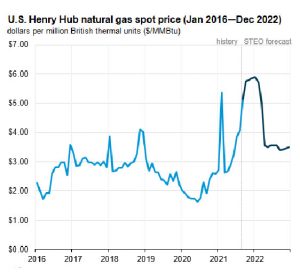
Looking at future pricing, it looks like the answer the market is giving is no. We are currently in an elevated market with several drivers maintaining pricing where it is, in the near-to-mid-term. If we look further out into the curve, we see pricing is starting to normalize closer to a $3/MMBtu level. While a $3 market is getting closer to a normal, it is still elevated considerably from where it was just a year ago. COVID-19 shutdowns in early-to-mid-2020 had the exact opposite effect on natural gas compared to what we are seeing now. Prices were approaching record lows as demand was minimal due to everything being closed. The price swing that we have seen from the summer of 2020 to the summer of 2021 has been substantial and indicates that there is a lot of uncertainty about covering new sources of demand that come online. That tells us that the market believes this is a seasonal issue that will be corrected in the future for the moment. There is a lot of variability as to what happens in the future based on this winter’s weather, what happens with LNG demand issues in Asia and Europe, production staying somewhat constant, and power generation demand as more coal plants are decommissioned and the generation stack continues to rely on natural gas to replace the gap created from those older plants going offline. An easy way to see an example of this is looking at the cost of gas contracts these days. If you are looking for a short-term 6-month or 12-month term deal, the price is generally higher as it’s based solely in the timeframe that prices are inflated. If you look at a 36-month term deal, the prices are a bit lower as you get some help from lower prices into the future.
Exhibit 2
Source: U.S. Energy Information Administration (EIA) (Oct. 7, 2021)
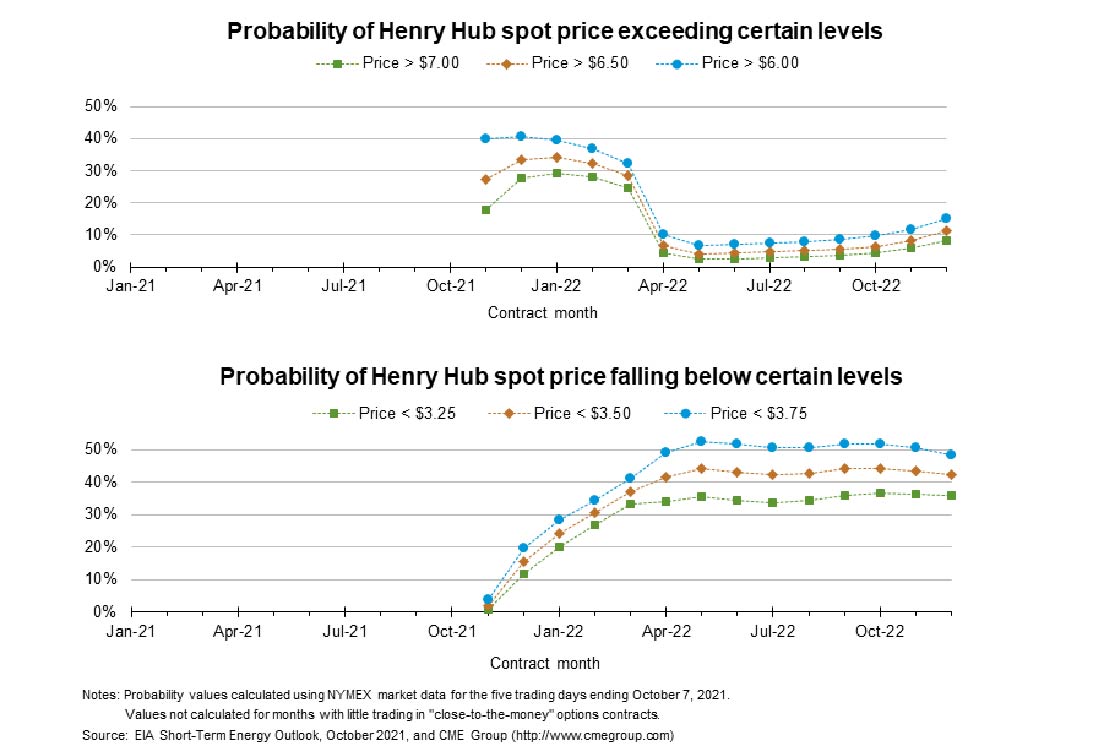
Exhibit 3
Source: U.S. Energy Information Administration (EIA) (Oct. 7, 2021)
We’re Here to Help
So for anyone who is looking to sign a new natural gas contract, extend their current service, bring a new natural gas fueled product online or is just checking the pulse of the market – AEP Energy is here to help. Here’s our advice. Take a look at your current contract and your expected needs. Look into longer term options that are in the 18-36-month range to try and capture some of the lower prices further out and mitigate the higher short-term pricing we are seeing, especially for this winter. Make sure you are aware of your contract dates so that you avoid rolling into a variable rate. If you have any questions about natural gas or would like to speak to us, click HERE or if you are already working with an AEP Energy Sales Representative, they will happily provide more information about our natural gas strategies.
AEP Energy does not guarantee the accuracy, timeliness, suitability, completeness, freedom from error, or value of any information herein. The information presented is provided “as is”, “as available”, and for informational purposes only, speaks only to events or circumstances on or before the date it is presented, and should not be construed as advice, a recommendation, or a guarantee of future results. AEP Energy disclaims any and all liabilities and warranties related hereto, including any obligation to update or correct the information herein. Summaries and website links included herein (collectively, “Links”) are not under AEP Energy’s control and are provided for reference only and not for commercial purposes. AEP Energy does not endorse or approve of the Links or related information and does not provide any warranty of any kind or nature related thereto.
3 min read Let’s talk about something that’s making waves in the energy sector: demand management. Specifically, how it can help businesses navigate the rising capacity prices in PJM. Whether you’re a business owner or an operations manager, you’ll want to pay attention to this. What is Demand Management? Demand management is a strategy where …
In the ever-evolving landscape of energy markets, a significant development has emerged from Pennsylvania. Governor Josh Shapiro and PJM Interconnection have reached a pivotal agreement aimed at protecting consumers from steep electricity price hikes. This agreement is not just a win for Pennsylvania but for the entire PJM region, which spans 13 states and the …
Enter your zip code to see energy plans in your area
Already an AEP energy customer?Login to view account details or enroll at the same rate as new customers.
We found several utilities in your area! Please select yours below:
AEP Energy Reward Store is filled with a variety of energy-saving products for your home. It is a simple and convenient way for you to shop for items to make your home more energy efficient while saving you time and money.
Collect Reward Dollars each month ($5/electric, $3/natural gas) for simply being an AEP Energy Customer.
Shop AEP Energy Reward Store for energy-efficient products like smart thermostats, LED lighting, and more.
Redeem your accumulated Reward Dollars and enjoy smart solutions for your home.
We're Sorry
Brandi Nye, Managing Director of Business Solutions
Brandi is an expert in her field with professional experience in the sustainability industry. Not only does Brandi have solid base knowledge, but she continues to grow her acumen through various learning and development experiences. Brandi is a creative and thoughtful utility professional with expertise in regulatory and utility operations.