The Future of Transmission Costs and How it Impacts Your Organization
CommercialMar 30, 2021
Previous issues of Customer Insights provided a transmissionservice overview, explaining how transmission is regionally administered and affects customer bills, as well as tips on transmission service cost management. In this issue of Customer Insights, we will dive a little deeper into what factors drive transmission cost.
How transmission costs are billed
Most energy buyers are familiar with transmission as a potentially costly line item on their energy bill. Depending on which utility service territory the power is consumed, transmission is either a component that is billed by the competitive supply company if the customer is shopping for service or the utility itself as a non-bypassable line item.
All customers in Ohio, even those purchasing power from a retail energy supplier, are billed transmission by the utilities in Ohio. As their retail energy supplier, AEP Energy’s Ameren customers as well as the remainder of our PJM customers outside of Ohio receive transmission service as a fixed or pass-through cost depending upon the energy product elected from us.
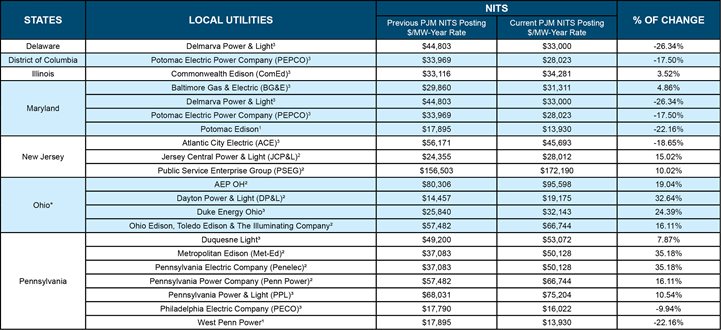
Table one: PJM NITS rates ¹FERC Action ²Effective Calendar Year (i.e. 1/1/2021 – 12/31/2021) ³Effective Energy Year (i.e. 6/1/2020 – 5/31/2021) *Ohio NITS are passed through by your local utility.
The cost of transmission is determined by a utility-specific filing of formula rates aimed to recover the utility’s cost of investment, maintenance and operating costs in transmission infrastructure. These costs are often updated and approved on an annual basis. This rate, approved by the Federal Energy Regulatory Commission (FERC), is referred to as Network Integrated Transmission Service or NITS.
As demonstrated in table one above, many transmission zones in PJM have seen steep year-over-year increases to NITS rates. The PSE&G zone continues to lead with a staggering $172,190/MW per year rate in 2021 while AEP
Ohio comes in second place after a year-over-year increase of 19% to its NITS rate. West Penn Power and Potomac Edison, on the other hand, reduced NITS rate by 22.16% over last year and is now the least costly transmission zone at $13,930/MW per year.
MISO’s Board of Directors approved the 2020 Transmission Expansion Planning Report last December which proposes over $4 billion worth of transmission enhancement projects. Year-over-year changes to Ameren’s NITS rates can be seen in table two.
Table two: Ameren NITS rates through the years
How transmission costs are calculated
Given that the transmission grid must be built to be able to handle delivering power under high-demand conditions, transmission costs are assessed not on a volumetric (by kWh consumed) basis but rather a demand (by peak kW) basis. In the case of supplier-charged transmission in PJM, that peak demand is called Network Service Peak Load (NSPL), which is an annual, by-meter allocation of the customer’s coincident peak demand to the utility’s prior year’s peak demand hour. Ameren customers’ transmission obligation is determined on a monthly assessment of the customer’s demand during each of Ameren’s monthly coincident peaks. In the event that transmission is a utility billed component, various different methods may be employed to determine customer demand but usually this occurs as a monthly, customer-specific non-coincident peak (which is also often called bill demand).
Transmission cost to a customer is determined by the following formulas:
PJM: NSPL x DZSF x Zonal NITS Rate (x Days) = Cost to Customer
NSPL: Network Service Peak Load DZSF: Daily Zonal Scaling Factor
Many utilities will apply a Daily Zonal Scaling Factor to ensure the sum of NSPLs is equal to peak load on which rates are based
Zonal NITS Rate: Network Integrated Transmission Service rate by utility zone
Days: The number of days in the relevant billing period
MISO:TCP x Zonal NITS Rate (x Days) = Cost to Customer
TCP: Transmission Coincident Peak (i.e. customer load at time of Ameren system peak load)
Zonal NITS Rate: Network Integrated Transmission Service rate by utility zone
Days: The number of days in the relevant billing period
How transmission works
To explore what is behind some of these steep regional increases in rate filing, let’s review the physical aspects of transmission service.
Transmission is the part of electric service that deals with transporting electricity from the place of generation to the place on the grid where the power is being consumed. This occurs at high voltages and potentially across long stretches of geography. It is up to the system operator (such as PJM or MISO) to ensure that the amount of MW supplied onto the grid at any given moment matches the amount of MW consumed. Since generation and consumption in most cases are not geographically co-located, a viable path of transmission must exist to move the electrons from point A to point B.
Each transmission line has an inherent maximum “carrying capacity” of how much volt-ampere can be passed through before its thermal limit is reached. When a transmission line is being pushed against its limits, this creates a reliability concern for the system operator as well as indicates a state of congestion. These conditions are expressed as a part of the Locational Marginal Price of Energy. Conditions of high congestion imply an inefficient energy market and potentially unreliable status of power supply.
The Northeast blackout of 2003, which affected over 50 million people across the U.S., as well as Ontario, was caused by a power surge which overloaded several transmission lines, exacerbated by a software bug that failed to redistribute the load onto other lines, causing cascading power outages by a system knocked out of kilter.
Drastic measures by system operators needing to shed load to keep a grid in balance was most recently experienced again last month in ERCOT where extreme weather forced multiple generators offline, leaving the grid unable to cover the power demand on the system.
In the aftermath of the 2003 blackout, the federal government introduced reliability standards regulating the electrical grid as part of the Energy Policy Act of 2005. With reliability of uninterrupted power supply receiving more dedicated focus on the federal level, transmission infrastructure investment has been prioritized and incentivized by the FERC.
The future of transmission
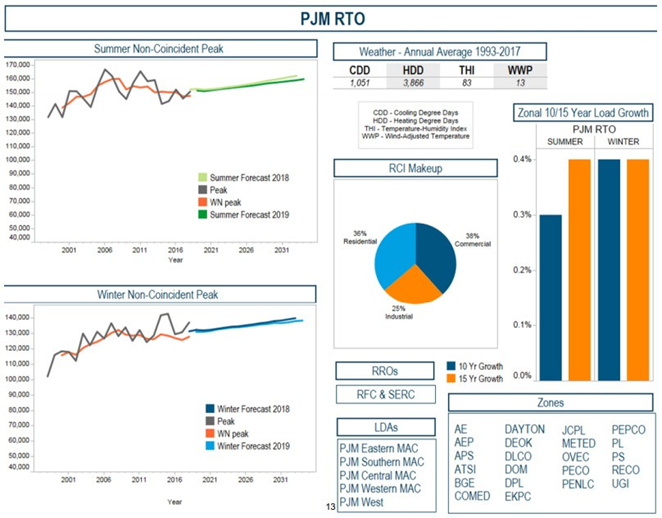
While there has not been significant total load growth in regional transmission network areas over the last decade, a resilient power grid is one that can respond to not only overall and seasonal changes in demand and supply but also momentary surges and dips. For example, PJM’s zonal 10 to 15-year load growth is shown below. In many cases the transmission infrastructure has become aged and the turnover of the generation stack is creating an ever-changing picture of moving power between generation and supply in an optimal fashion. As a result, many transmission owners have invested heavily in grid upgrades and modernization programs.
Exhibit A
Sometimes natural disasters cause damage to transmission lines which can lead to localized costly repairs or prompt enhancements to be better prepared in the future, building the grid’s resilience as well as transmission capacity for future load growth. For example, PSE&G mainly suffered damage to its distribution lines during Hurricane Sandy in October 2012. While many of its higher voltage transmission lines were largely spared, the utility had to overhaul much of its transmission system regardless in order to comply with PJM interconnection requirements. PSE&G also upgraded switching stations to handle higher voltage lines and responded to the storm by raising equipment height to meet FEMA guidelines.
The future impact of electrification efforts (such as the proliferation of electric vehicles) on total load are yet hard to predict. Overall adoption rates have been slow to-date. However, even if overall load would not grow at a rate that would create pressure on supply, it is likely that the load curve would experience reshaping with system peaks shifting into later evening hours than has occurred historically as well as creating localized pressure at substations feeding large residential areas. Therefore, in the case of electrification efforts, near and medium-term infrastructure investment demands are more likely going to affect distribution equipment rather than long-haul transmission.
More noticeable than changes in the way people consume power due to electrification is the changing of the supply stack with more renewables penetrating the market. MISO recently published a thorough report, titled RenewableIntegration Impact Assessment. It points out that MISO is preparing for an “unprecedented pace of change”. Renewable assets are often clustered in specific geographical areas with beneficial environmental attributes supporting a specific technology. This may increase the locational disconnect of where power is generated over where it is consumed. The transmission network must be able to efficiently move the energy to where it is needed. According to MISO’s study, renewable proliferation such that more than 30% of the supply stack is made up of renewable technology assets will lead to challenges in managing the system which are “not insurmountable and will require transformational change in planning, markets and operations.” The study goes on to explain that pairing renewable assets with batteries will benefit system reliability, but it is transmission, not batteries, that will continue to be the most effective mechanism of delivery for the majority of the resource mix.
All of this points to long-term investments to upgrade the transmission system will continue in the foreseeable future, which means that costs will have to be collected from the load it supports.
A load taker can manage future transmission costs by reducing load during peak demand periods, thus reducing future NSPL tag in areas where transmission is billed by supply companies.
AEP Energy’s PeakAdvisory® Service for NSPL Peak Management is designed to inform you of likely coincident peak hours to help manage your transmission obligation for the coming year. With our complimentary service, an advance alert will be emailed to you at least a day ahead of the forecasted peak, followed by a final notice to confirm or cancel the event. You choose to activate your organization’s applicable load curtailment strategies to manage and reduce your transmission costs. Controlling transmission costs within utility service areas where transmission is billed by the local utility as part of its bundled rate tariffs is more challenging by being billed based on monthly peak demand. AEP Ohio, Dayton Power and Light and FirstEnergy Ohio offer limited programs that allow certain customers to elect alternative billing mechanisms that provide customers with enhanced opportunities to manage transmission costs.
Interested in learning more?
Another strategy that AEP Energy, in collaboration with our sister company AEP OnSite Partners, has implemented for several customers is the pairing of a traditional energy supply agreement with the installation of an on-site, gas- fired engine. Aside from providing a measure of reliability for critical business processes, the strategic deployment of the engine can assist in peak management that does not necessitate traditional load curtailment actions.
For more details on these programs and whether you might qualify, please contact your AEP Energy sales representative.
AEP Energy does not guarantee the accuracy, timeliness, suitability, completeness, freedom from error, or value of any information herein. The information presented is provided “as is”, “as available”, and for informational purposes only, speaks only to events or circumstances on or before the date it is presented, and should not be construed as advice, a recommendation, or a guarantee of future results. AEP Energy disclaims any and all liabilities and warranties related hereto, including any obligation to update or correct the information herein. Summaries and website links included herein (collectively, “Links”) are not under AEP Energy’s control and are provided for reference only and not for commercial purposes. AEP Energy does not endorse or approve of the Links or related information and does not provide any warranty of any kind or nature related thereto.
3 min read Let’s talk about something that’s making waves in the energy sector: demand management. Specifically, how it can help businesses navigate the rising capacity prices in PJM. Whether you’re a business owner or an operations manager, you’ll want to pay attention to this. What is Demand Management? Demand management is a strategy where …
In the ever-evolving landscape of energy markets, a significant development has emerged from Pennsylvania. Governor Josh Shapiro and PJM Interconnection have reached a pivotal agreement aimed at protecting consumers from steep electricity price hikes. This agreement is not just a win for Pennsylvania but for the entire PJM region, which spans 13 states and the …
Enter your zip code to see energy plans in your area
Already an AEP energy customer?Login to view account details or enroll at the same rate as new customers.
We found several utilities in your area! Please select yours below:
AEP Energy Reward Store is filled with a variety of energy-saving products for your home. It is a simple and convenient way for you to shop for items to make your home more energy efficient while saving you time and money.
Collect Reward Dollars each month ($5/electric, $3/natural gas) for simply being an AEP Energy Customer.
Shop AEP Energy Reward Store for energy-efficient products like smart thermostats, LED lighting, and more.
Redeem your accumulated Reward Dollars and enjoy smart solutions for your home.
We're Sorry
Brandi Nye, Managing Director of Business Solutions
Brandi is an expert in her field with professional experience in the sustainability industry. Not only does Brandi have solid base knowledge, but she continues to grow her acumen through various learning and development experiences. Brandi is a creative and thoughtful utility professional with expertise in regulatory and utility operations.