2022 Energy Overview: What’s Changed and What’s Ahead
CommercialNov 4, 2022
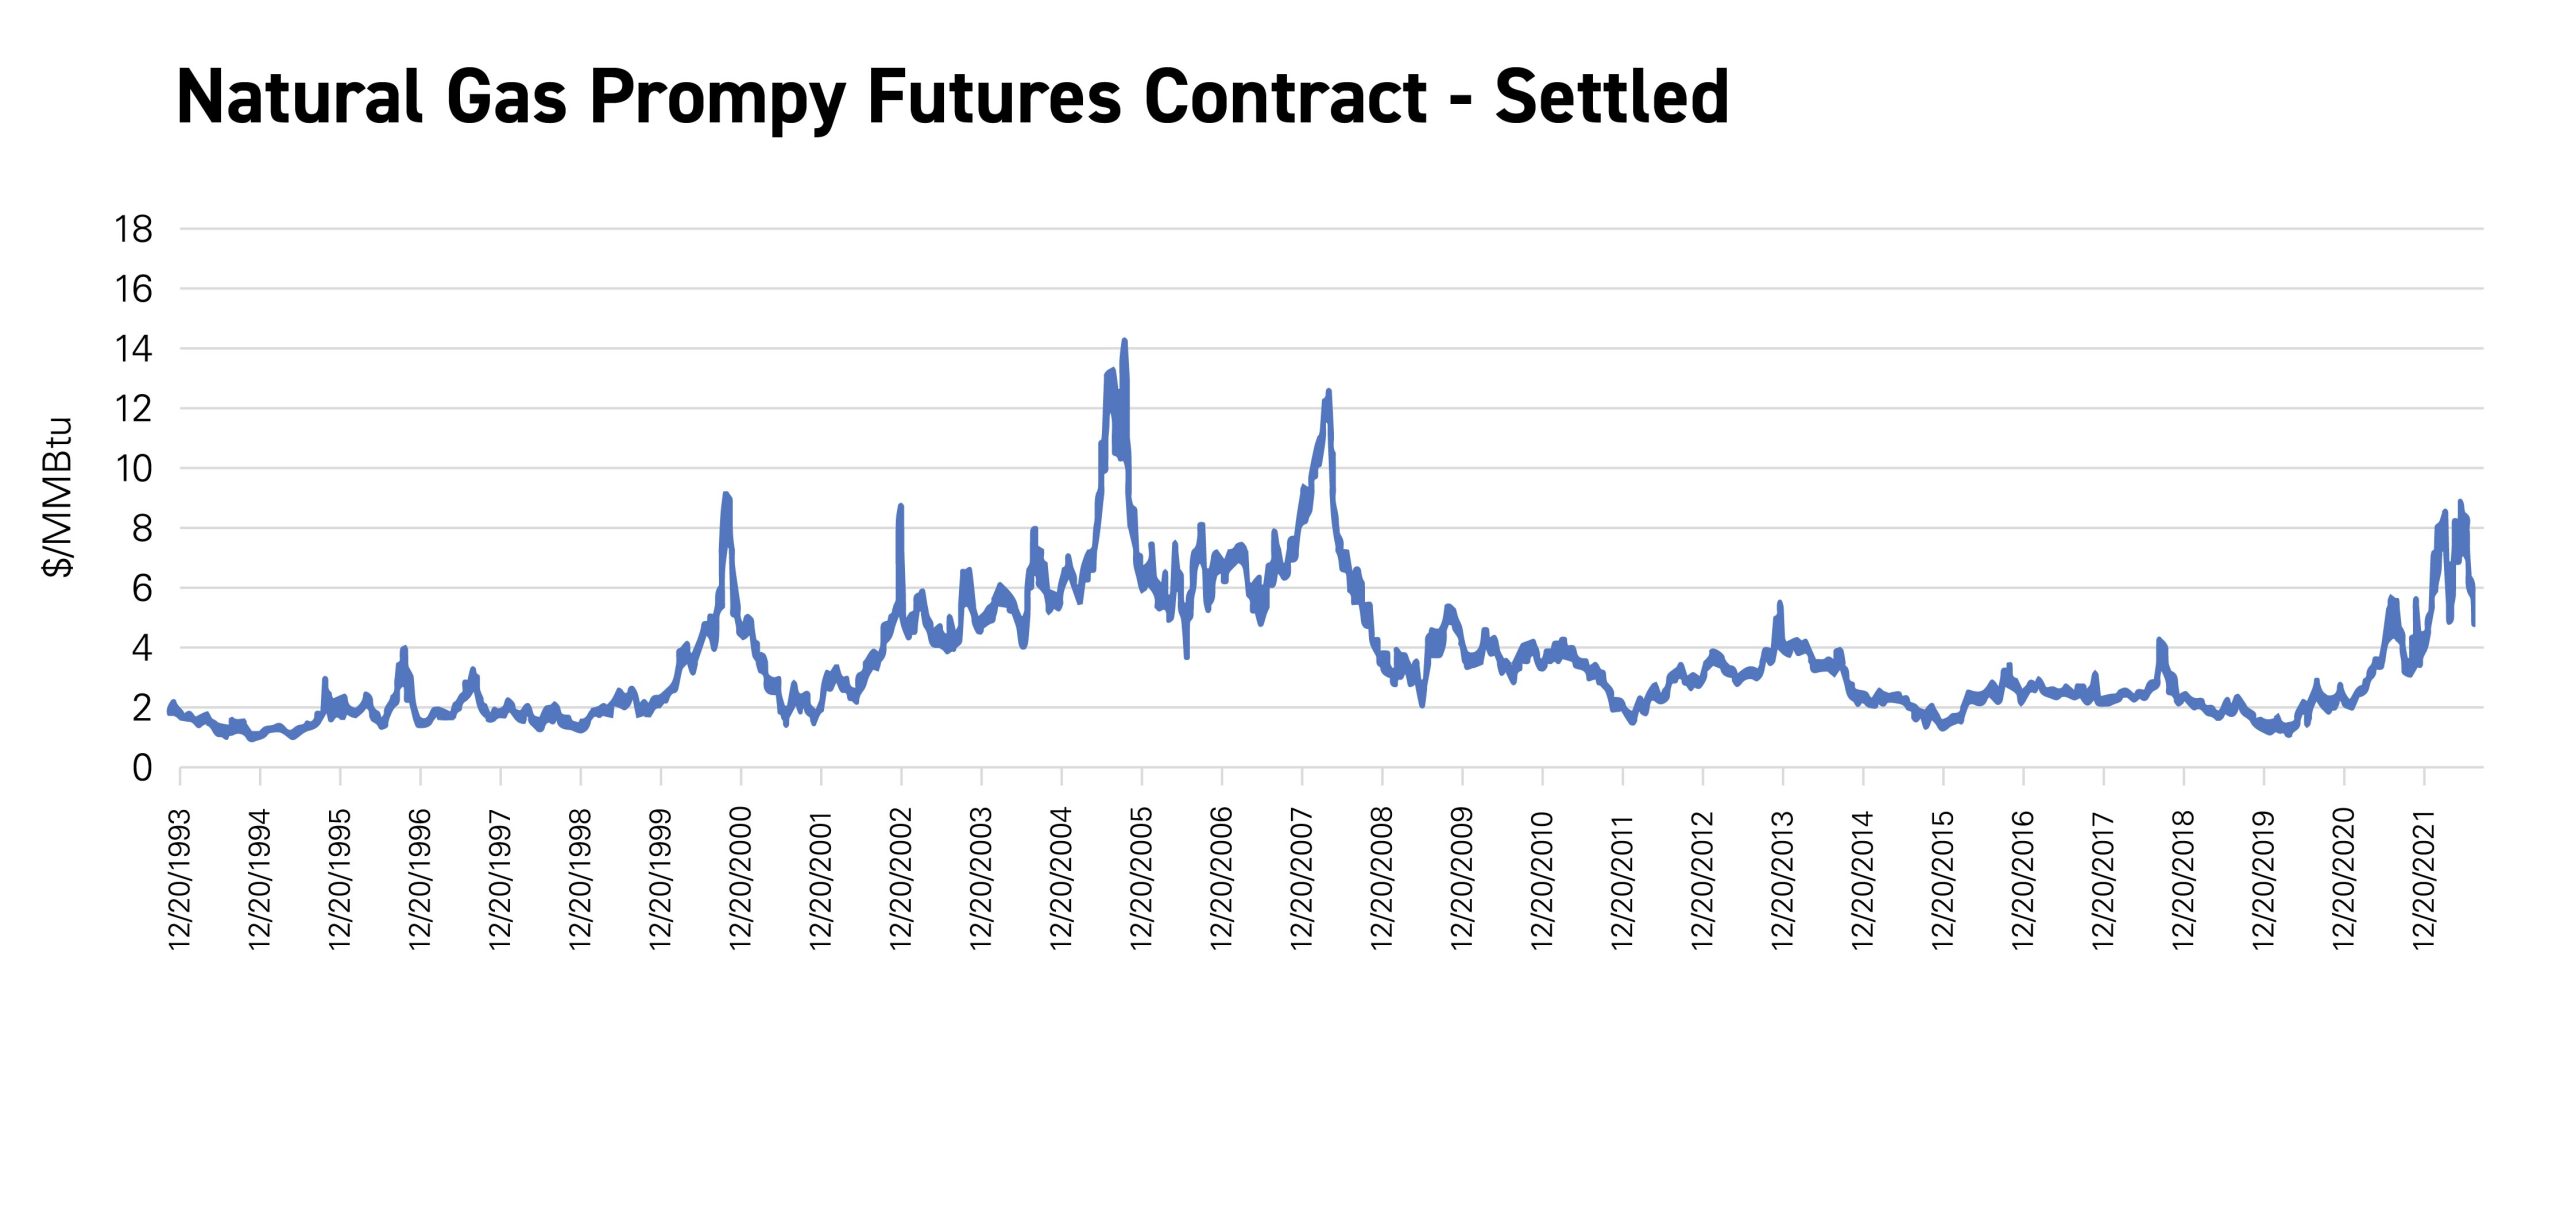
Some may refer to the year 2022 as the “year of tumult” for energy markets. With unprecedented high natural gas pricing and volatility, including a run-up not seen since 2007-2008, the natural gas market is finally retreating from a 14-year high of approximately $10/MMBtu, currently at around $5/MMBtu (See Exhibit A).
Similarly, U.S. power forward and spot markets witnessed extreme pricing turbulence and a build-up as well. In PJM-RTO, day ahead and real-time power prices have averaged $105/MWh, with a $246/MWh maximum for day-ahead pricing and an $817/MWh maximum for real-time pricing in August – some of the highest pricing seen in PJM’s recent history. After a “sleepy” 2020 pandemic year, the years 2021 and 2022 saw a steady increase in commodity pricing levels and a sustained run-up in natural gas prices. On the demand side, the relative lack of demand from 2020 came back with a vengeance in 2021 and 2022.
In this issue of Customer Insights, we will provide an overview of what happened in the energy market this year, what changed, what held steady and what we may expect during the remainder of 2022 and beyond.
Exhibit A: NYMEX Natural Gas – Prompt Futures Pricing
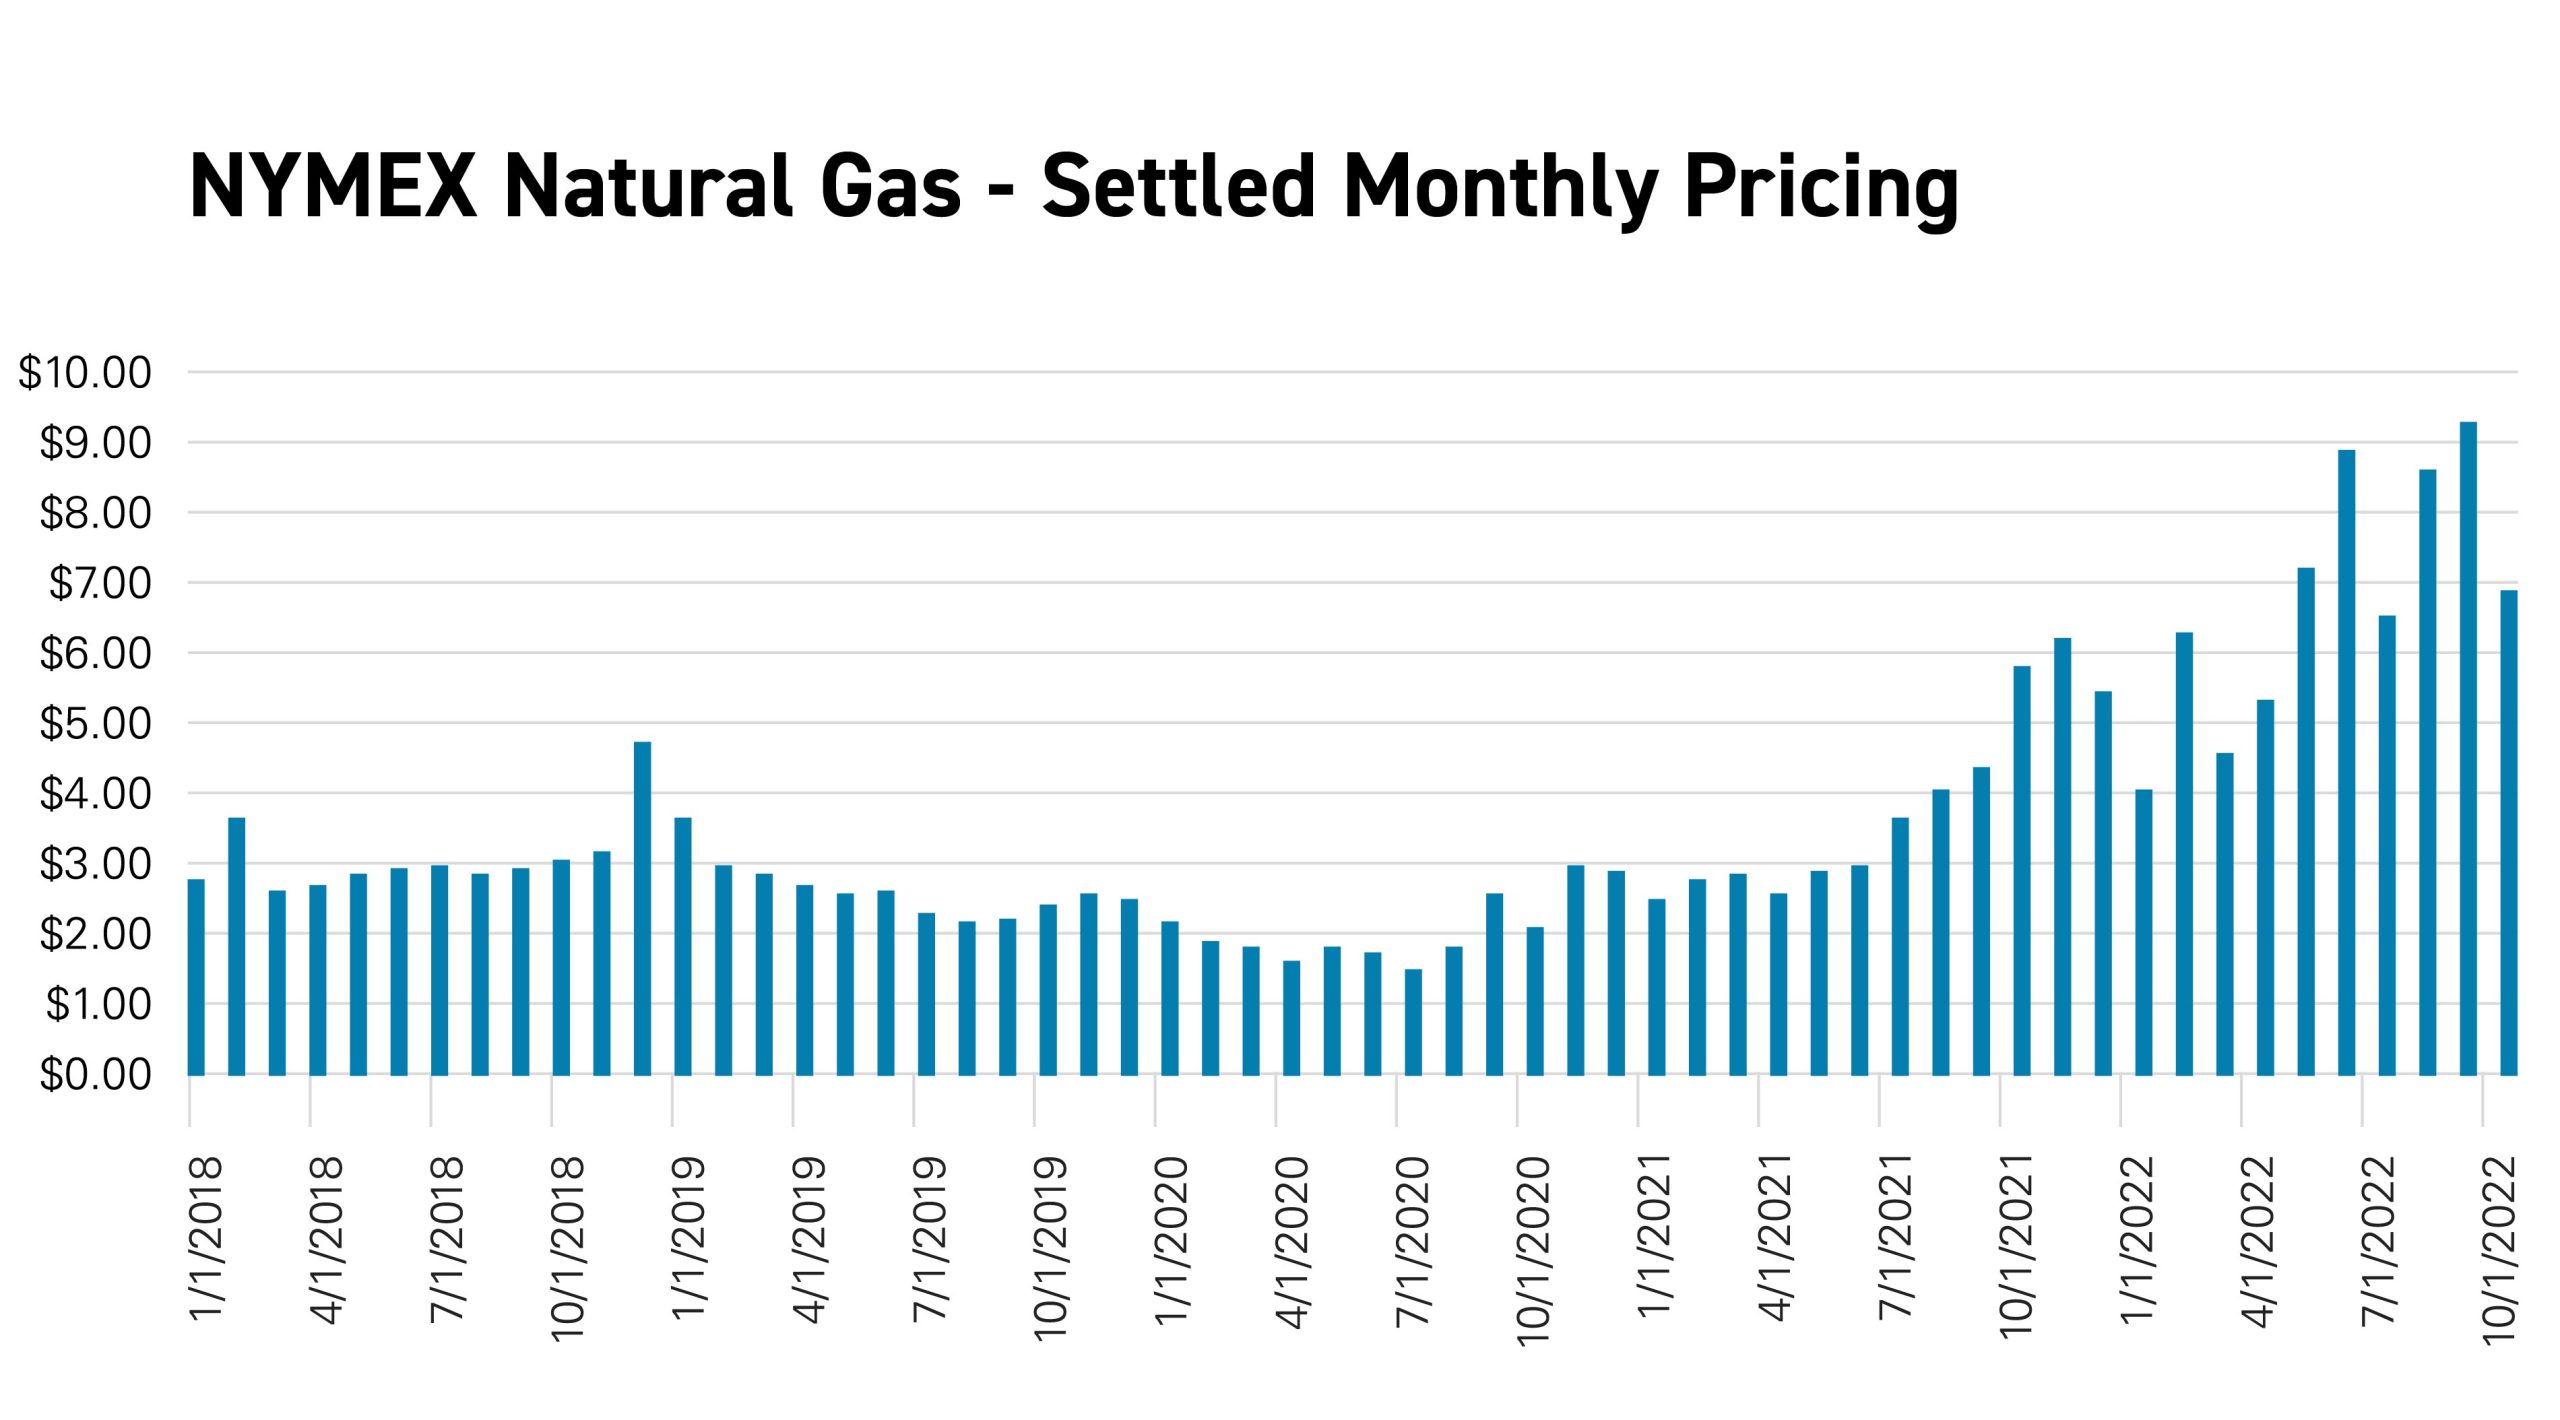
Before and during the COVID-19 pandemic, 2020 had been a year inundated with cheap natural gas supplies. Pricing was typically below a meagre $2.00/MMbtu (See Exhibit B), which did not seem sustainable in the long run. Subsequently, consumption dropped even more during the span of the COVID pandemic, pressuring prices even lower at the Henry Hub for natural gas.
In the fall of 2021, prices began climbing back due to growing concerns of natural gas scarcity, but weather was mild and storage remained high muting the overall effect of scarcity on pricing levels and preventing a wild run-up in prices. Natural gas pricing finally roared upwards in 2022 due to chronic shortages in injection levels to underground storage compared with the 5-year seasonal average. Now, Fall gas injections are bringing gas levels back up to their 5-year average, and thus pressuring price levels back down to more “normal” levels than the previous few months.
Exhibit B: NYMEX Natural Gas – Settled Monthly Pricing
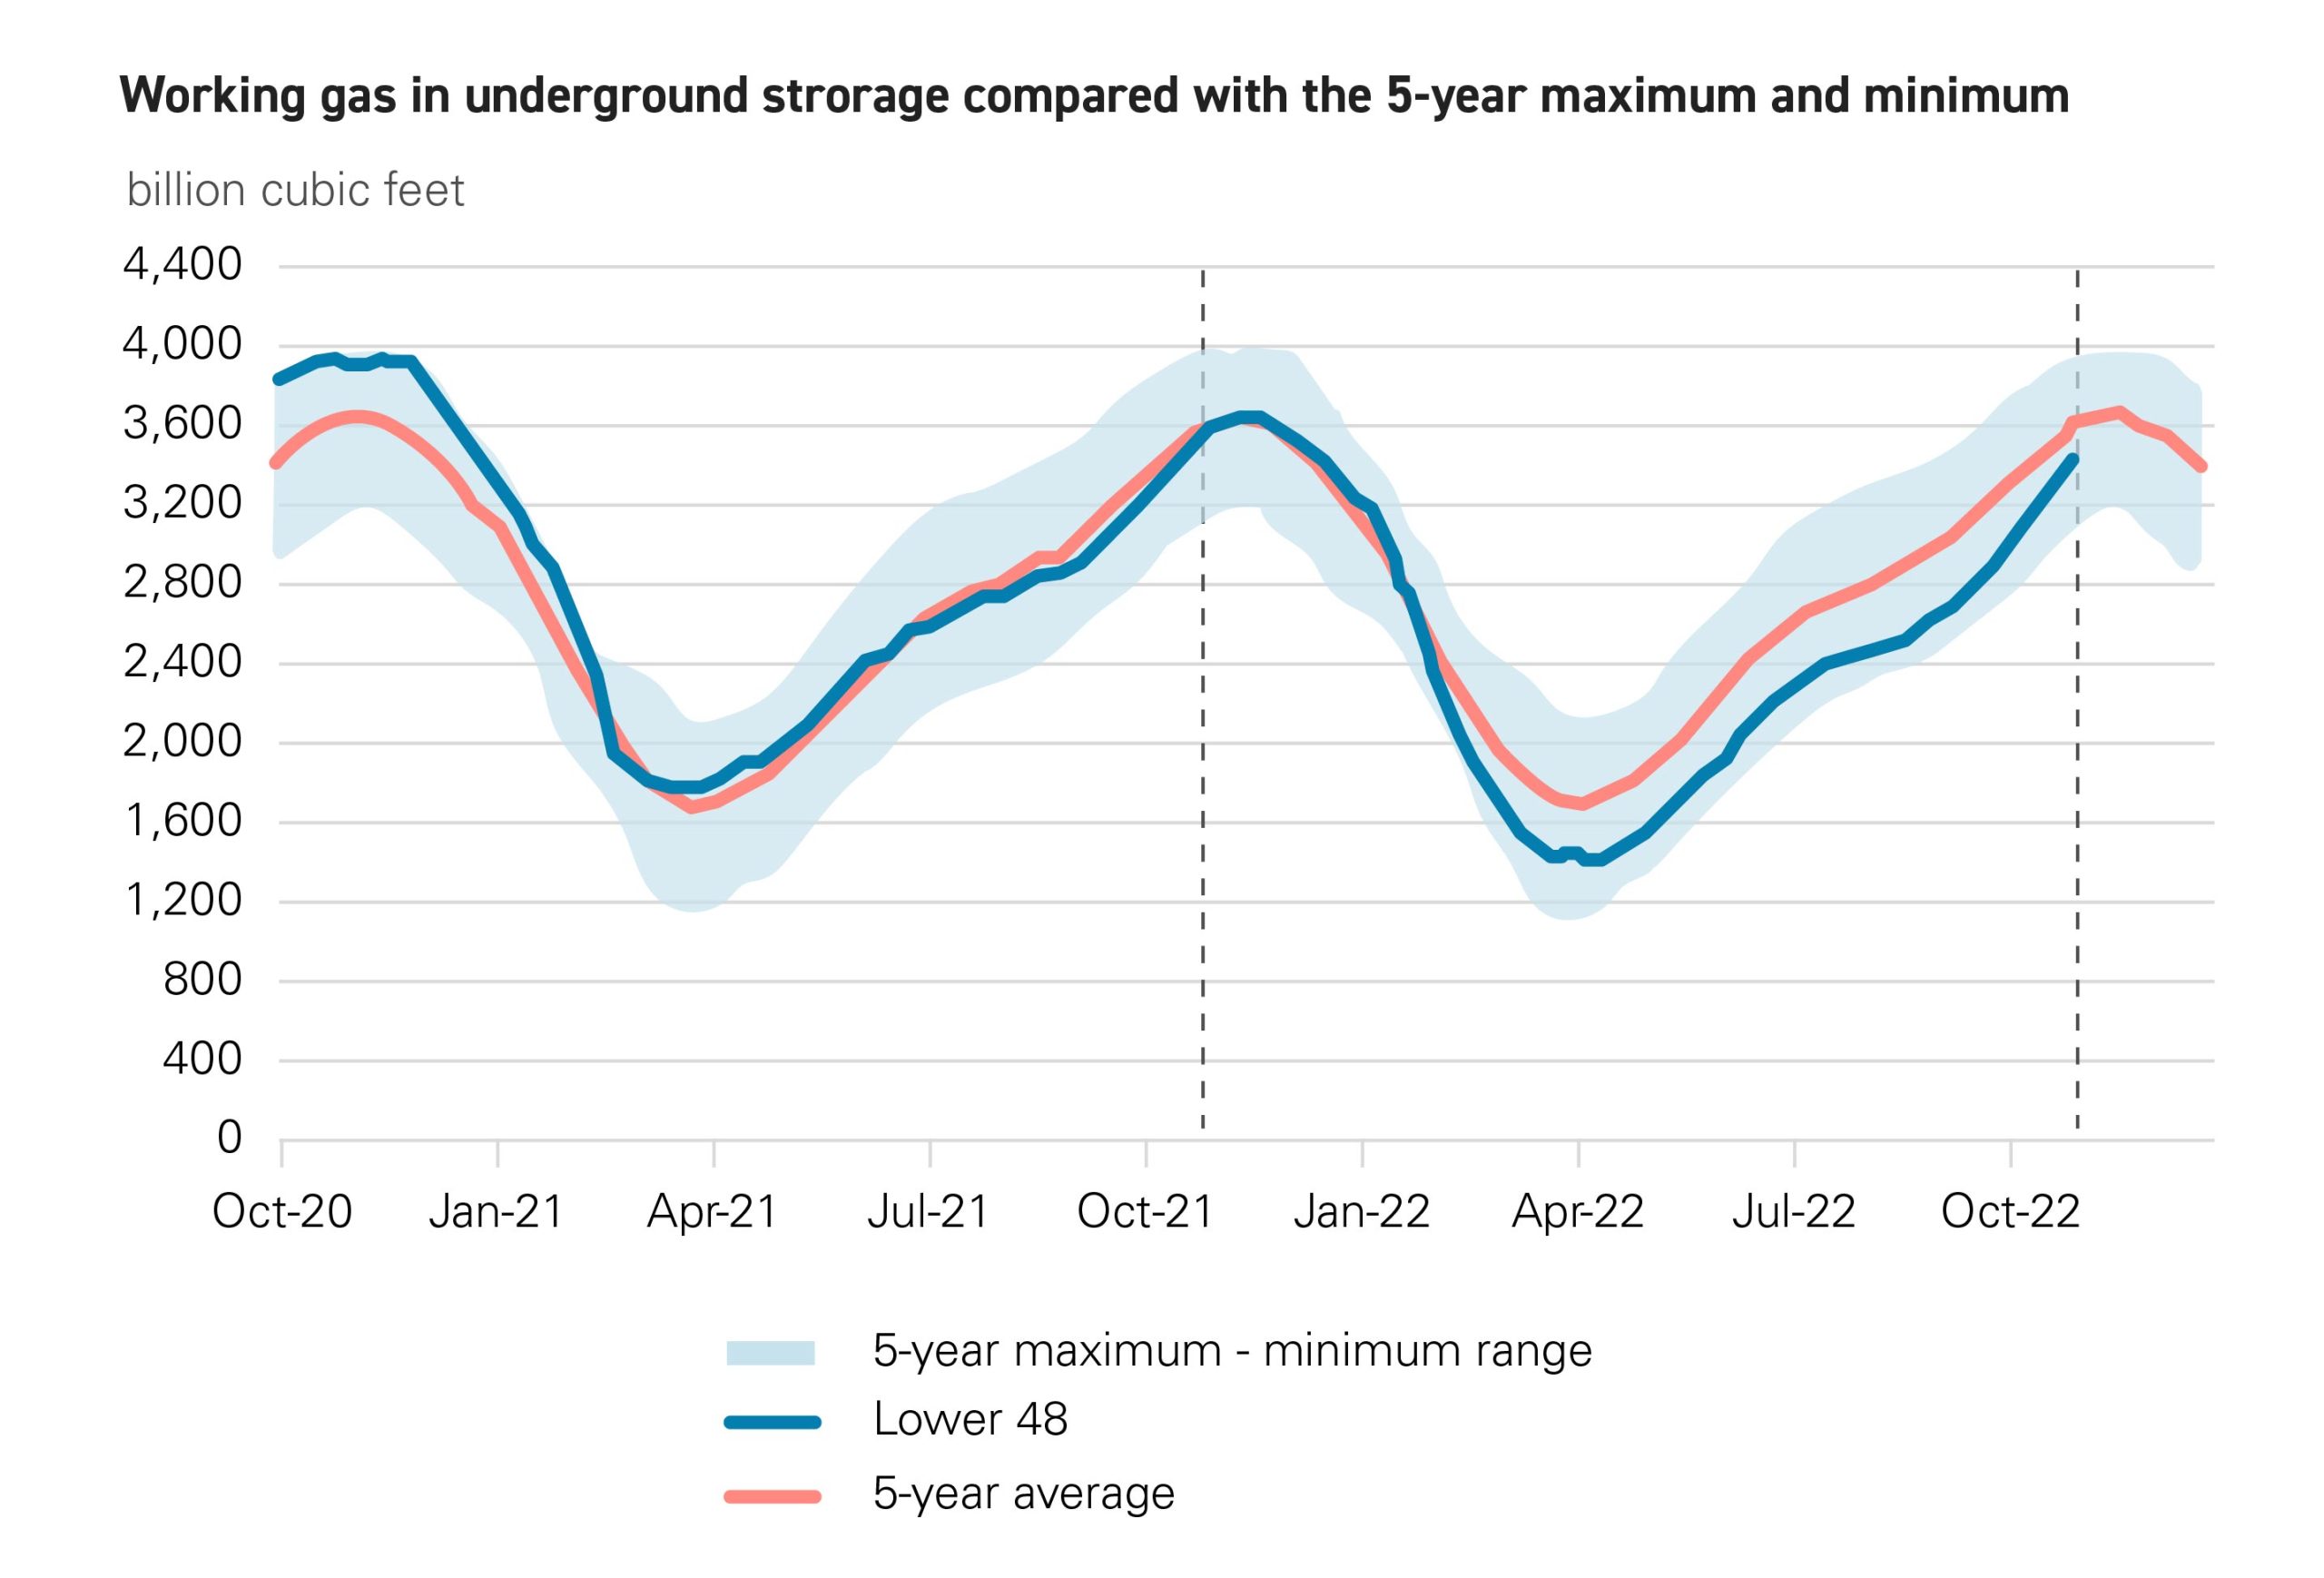
The relative shortages were apparently driven by the U.S. exporting liquified natural gas (LNG) supplies to Europe in order to alleviate Russia’s curtailment of gas supplies to Western Europe. According to U.S. Energy Information Administration (EIA) data, total U.S. production on average from March 2022 through September 2022 was hovering near the 5-year average low; a bullish fundamental indicator for natural gas prices (See Exhibit C).
Most recently, natural gas inventories have been increasing markedly from 5-year lows, applying some much-needed bearish relief on the prompt month gas contract to help move it off 14-year pricing highs (as of September 15, 2022). On September 16, 2022 a railroad strike was narrowly averted which put even more needed bearish pressure on the prompt gas month, pushing it down 8% over the trading day and averting more potential coal-to-gas switching since coal is transported by rail from mines to regionally critical power plants. Bearishness on the natural gas commodity may also be correlated with the recent downturn in the broader financial markets (NASDAQ, S&P500, DJIA). As of October 21st, 2022, the natural gas prompt futures contract dipped back under $5.00/MMBtu, a level not seen for 7 months (cf. March 21st, 2022).
What Changed
The electricity generation mix continued to shift toward renewable resources, though solar resources were hampered by the dual effect of the recent supply chain debacle and the Auxin solar probe with the U.S. Department of Commerce.
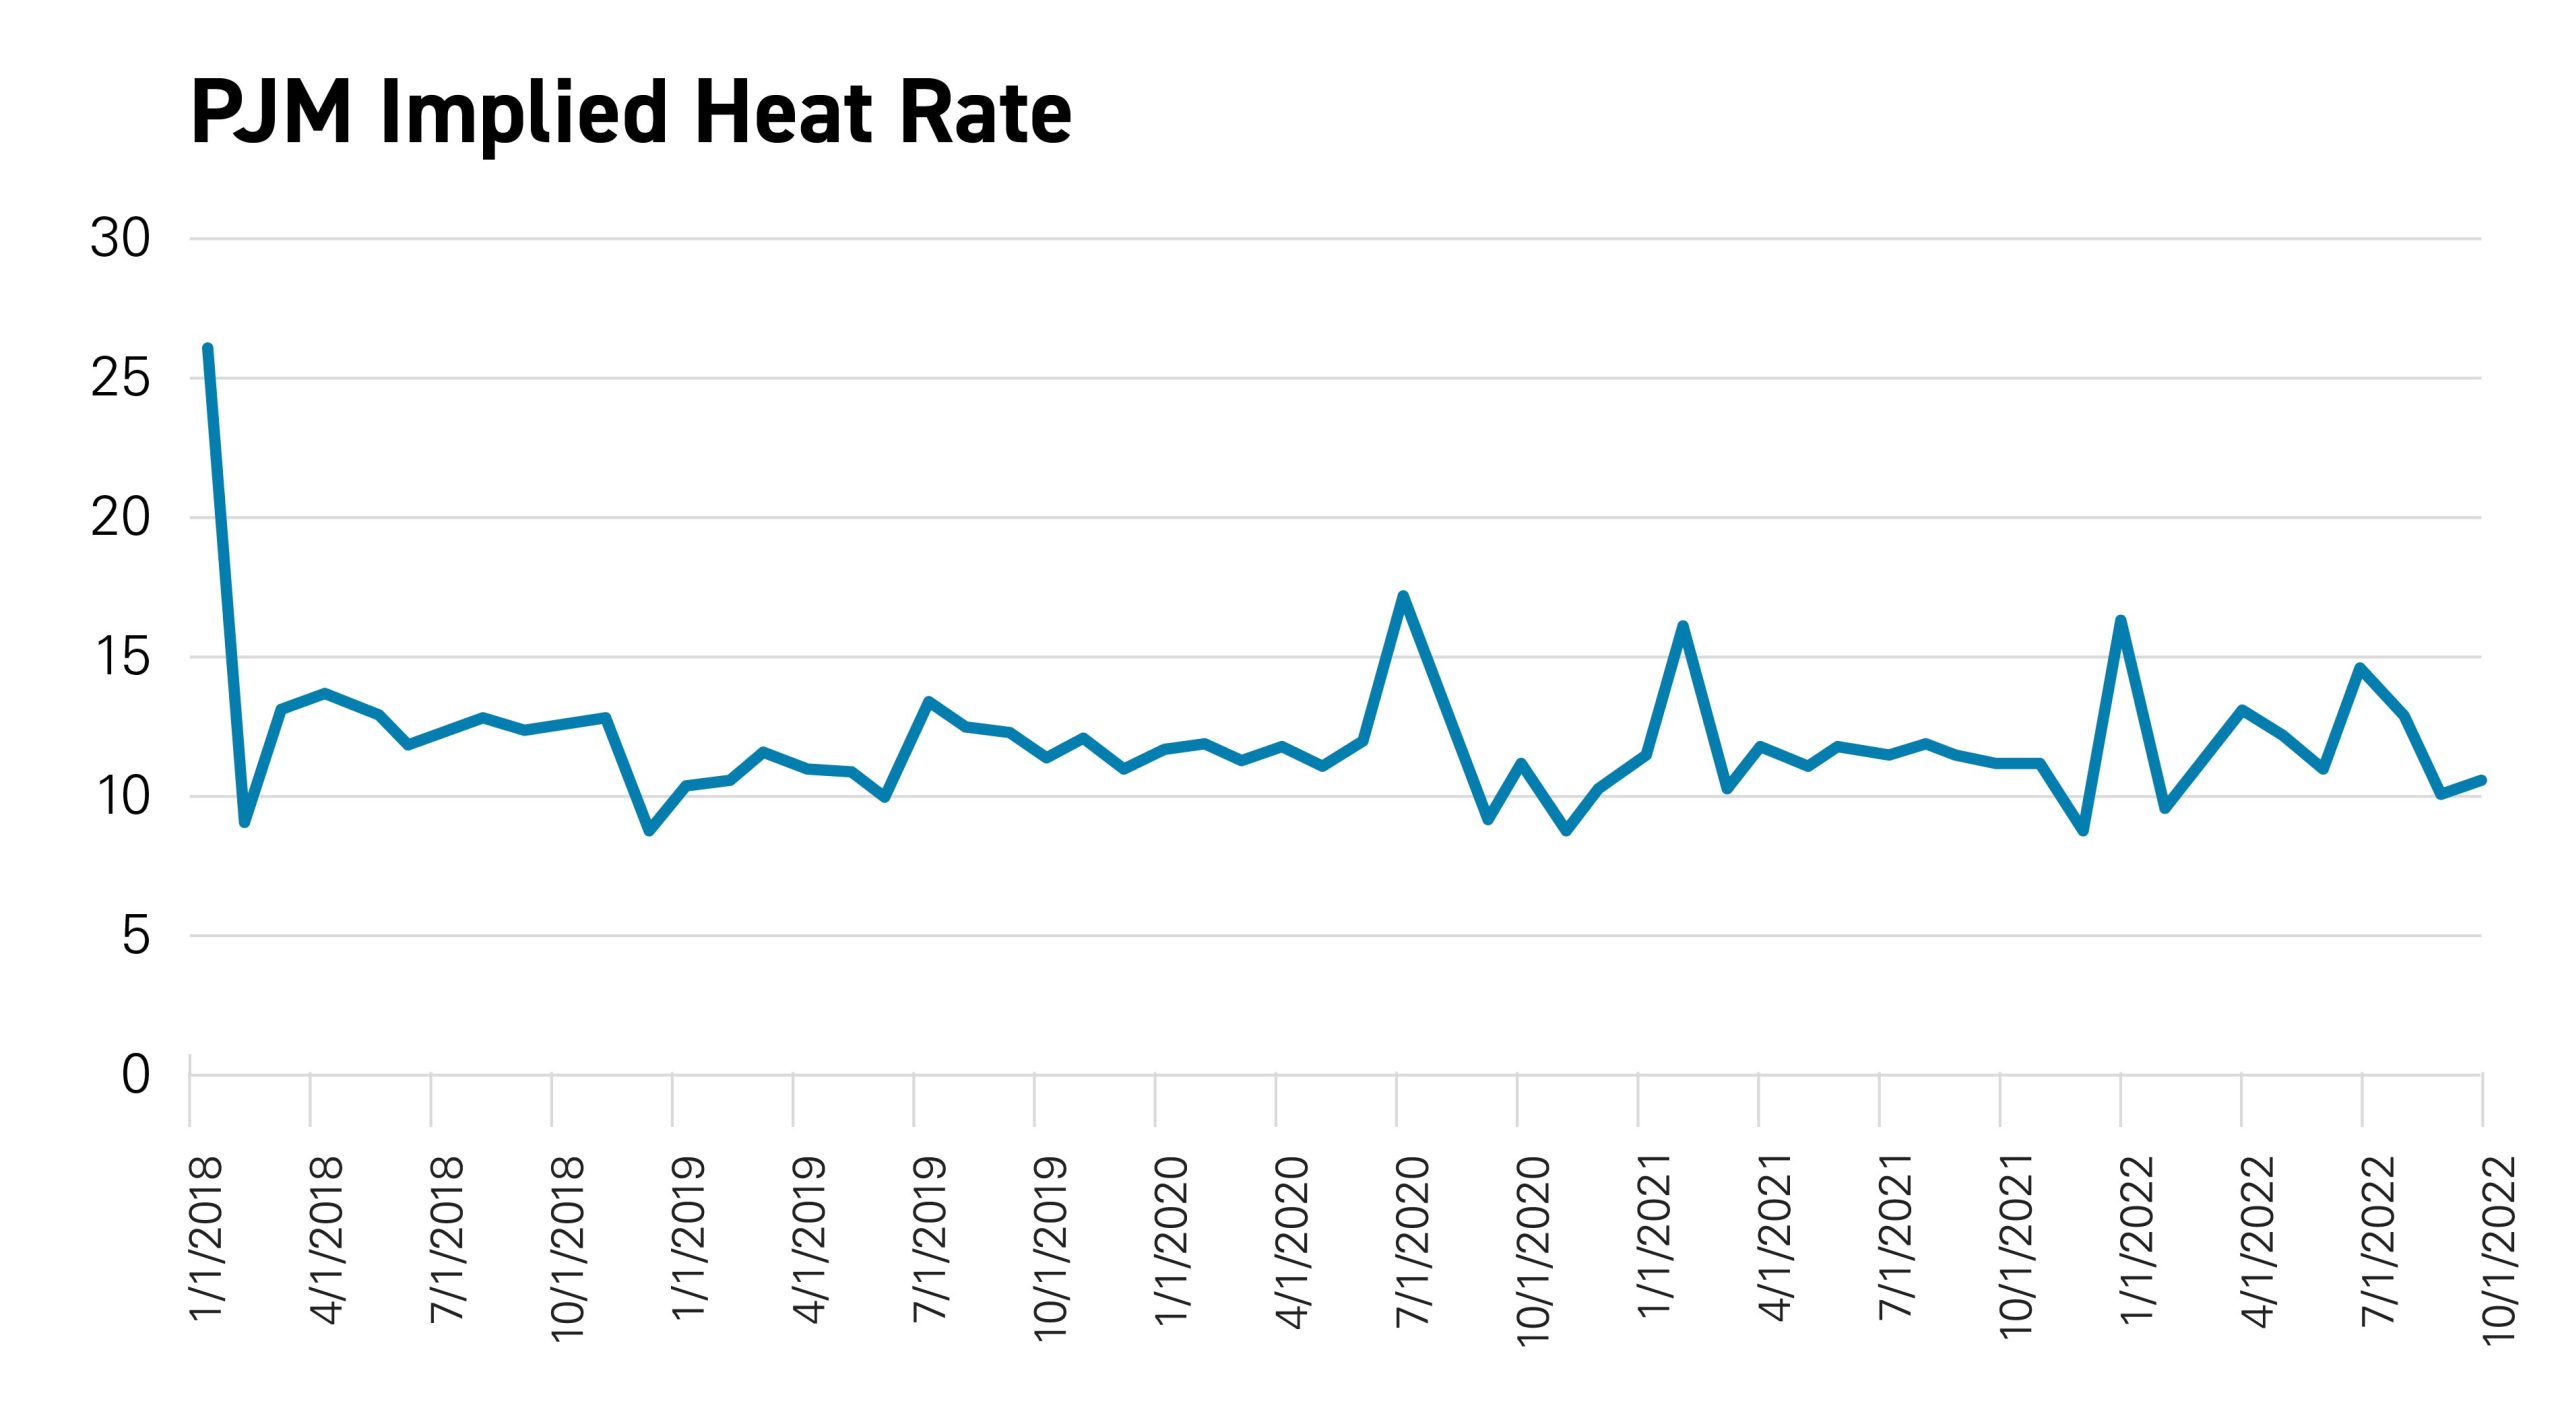
A more nuanced, but meaningful change occurred with heat rates in PJM. A heat rate, measured in MMBtu/MWh, is a measure of power plant efficiency and is the amount of natural gas needed to generate a MWh of electricity. To determine the system-wide heat rate, divide the power price by the natural gas price. By examining heat rates and understanding how they move over time, insights can be gained into power market fundamentals independent of underlying fuel price (e.g. natural gas) influences. Throughout 2021, the settled heat rate hovered around 10 MMBtu/MWh. For most of 2020, the implied heat rate decreased and leveled off in the 8.7 range when compared to over the last two to three years, due to a decrease in demand driven by the COVID pandemic. Given the number and diversity of generation sources in PJM, that is a meaningful deterioration in heat rates. Likely explanations for the trend in heat rates include coal retirements, renewable additions and the fact that load was suppressed during the COVID pandemic in 2020, with the exception of July 2020 where there was more activity on the demand side. Since demand increased in 2021-22, the demand curve intersected higher parts of the supply stack more often than previously (cf. August ’22), leading to significantly higher market-clearing heat rates. This is because higher-cost fuel types were often “on the margin” in 2022, on average (See Exhibit D).
The long-term view that renewable resources will continue to drive down marginal pricing in PJM has remained consistent, though this is being challenged in the short term with increased natural gas pricing which typically sets the marginal price in the RTO. The consensus view of power markets in the short term is that natural gas prices will remain much higher than previously, though not at all-time highs like we saw in August, with major banks forecasting around $6-7/MMBtu for winter of ‘22-23.
While the view on downward trending energy has been challenged recently by the general uptrend in global commodity prices, so too has the view on upward trending transmission costs. Transmission investment is based on decades of long projections and has not been impacted significantly by the slowdown. Continued investment in the transmission system is seen as critical to achieving the levels of renewable generation that many states and utilities have targeted, so it is likely that transmission costs to customers will continue their steady climb.
What We Expect
Despite robust fundamentals, it seems like the natural gas and power markets are very overbought. Going forward, it seems like prices will revert to fundamental levels, and that the run-up in pricing was largely event-driven with the Ukraine crisis and other supply-chain issues in immediate focus. From September 14-15, 2022, at which point natural gas markets witnessed a strong bearish reversal, the energy markets should be driven by a reversion to fundamental levels, coupled with shorter-term weather-related shocks. The Old Farmer’s Almanac is forecasting a cold winter for the Midwest and Northeast, which is likely already priced into current market levels. If the winter proves milder than forecasted, this could exert even more downward pressure on current price levels, though the risk of the opposite situation (i.e., a much colder than forecasted winter) materializing, is also present, which would push prices higher given that it was not previously expected.
Within the last decade, we have been reminded how volatile winter weather and winter energy pricing can be. With the polar vortex and bomb cyclone events, and now the increase in natural gas pricing, we have seen power pricing (LMPs) double and triple over normal levels. In the 2010’s, we saw substantial price volatility concentrated in the winter months in PJM. Now, we see that natural gas pricing volatility can be expected year-round, not just from weather but also from global events which have severely impacted “legacy” supply-demand dynamics.
We expect to see continued renewable generation growth in the PJM region. PJM has lagged behind other regions of the county in wind and solar build out due to interconnection queue and permitting delays. However, the economics have tipped clearly in this direction, even in light of the current challenges facing solar module imports from Southeast Asia. With coal generation continuing to likely be phased out and natural gas continuing to dominate PJM generation for the coming decade, it seems likely that additions will be mostly renewable.
What You Can Do
As energy markets have reached unprecedented highs coming out of heading into 2022, now is a great time to consider your energy strategy and determine whether you need a reset. Our previous Customer Insights editions are a great way to help you on a new energy strategy path for 2022 and beyond. Understand your renewable energy options, learn how spot vs. forward buying strategies can benefit your organization and find out how the cost of generating energy has continued to evolve. If you are still approaching energy the same way you always have, now’s the time for your strategy to evolve.
Interested in learning more?
If you are interested in learning more about AEP Energy’s view on market trends or how your organization might take advantage of new opportunities to unlock value in your energy spend, click HERE or if you are already working with an AEP Energy Sales Representative, they will happily provide more information.
AEP Energy does not guarantee the accuracy, timeliness, suitability, completeness, freedom from error, or value of any information herein. The information presented is provided “as is”, “as available”, and for informational purposes only, speaks only to events or circumstances on or before the date it is presented, and should not be construed as advice, a recommendation, or a guarantee of future results. AEP Energy disclaims any and all liabilities and warranties related hereto, including any obligation to update or correct the information herein. Summaries and website links included herein (collectively, “Links”) are not under AEP Energy’s control and are provided for reference only and not for commercial purposes. AEP Energy does not endorse or approve of the Links or related information and does not provide any warranty of any kind or nature related thereto.
The results of PJM’s latest Base Residual Auction (BRA) send a clear message to commercial and industrial (C&I) energy users: capacity costs are likely to remain a significant component of electricity bills, and underlying market fundamentals continue to point toward a tighter supply-demand balance. PJM secured 138,317.8 MW of capacity for the 2028/2029 delivery year …
As energy markets evolve, understanding the forces behind your electricity costs is more important than ever. AEP Energy’s Understanding Capacity Series is a must-watch for businesses looking to stay ahead of the curve and make informed energy decisions in the face of rising capacity costs. What’s in the Series? This insightful video series features AEP …
Enter your zip code to see energy plans in your area
Already an AEP energy customer?Login to view account details or enroll at the same rate as new customers.
We found several utilities in your area! Please select yours below:
AEP Energy Reward Store is filled with a variety of energy-saving products for your home. It is a simple and convenient way for you to shop for items to make your home more energy efficient while saving you time and money.
Collect Reward Dollars each month ($5/electric, $3/natural gas) for simply being an AEP Energy Customer.
Shop AEP Energy Reward Store for energy-efficient products like smart thermostats, LED lighting, and more.
Redeem your accumulated Reward Dollars and enjoy smart solutions for your home.