Levelized Cost of Energy: How Can This Benefit You?
CommercialMar 4, 2020
As an energy buyer, you have choices when it comes to how you interact with the energy market. Understanding the fundamental risks and trends in energy generation can help you gauge risk and position your approach in a way that’s best for your organization, however often that’s easier said than done.
In today’s rapidly evolving energy landscape, the fundamental forces driving the market are changing. Is power getting cheaper or more expensive? Is now the right time to invest in on-site generation? What’s the cheapest way to generate energy? And which technology is the right fit for you? With construction costs, fuel costs, subsidies and more thrown into the mix, it can be hard to pin down and understand a precise comparison between generation technologies. A Levelized Cost of Electricity (LCOE) analysis can help.
What is a LCOE?
An LCOE analysis is a useful way to assess the cost per unit of energy at which the cost to build and operate a given technology will be fully recovered. While imperfect, LCOE studies give us the best approximation of how competitive different generation technologies are relative to one another.
The U.S. Department of Energy’s (DOE) approach to LCOE is purposefully broad and includes cost and performance data from generating plants across the U.S. The analysis begins with a reasonable range of actual project construction costs and incorporates sensitivities around influential inputs including interest rates, tax rates and required returns on debt and equity. The analysis also includes a range of electricity generation output levels from plants around the country. Capacity factor, the actual output of a plant over a period of time versus its theoretical maximum output, is also a key input to the analysis and is based on observed capacity factors for given generation technologies currently deployed. Because the range of inputs into the analysis is purposefully broad, the results are also stated as a range. While it is tempting to look to the low end of the range for each technology, the distribution of both the inputs and the output is key to the LCOE approach, therefore the results are best considered as a range.
Analyzing the 2019 LCOE
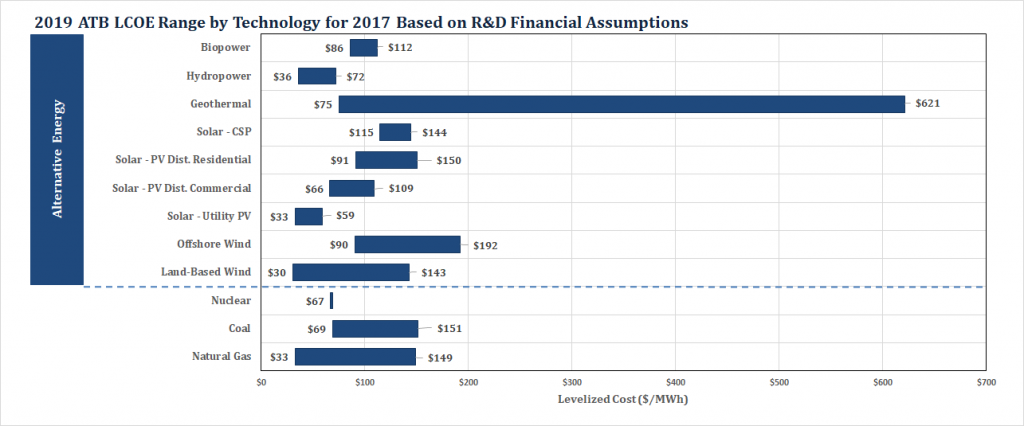
The results of the 2019 LCOE study, sponsored by the DOE and led by DOE analysts at the National Renewable Energy Laboratory (NREL) are below:
Source: NREL (National Renewable Energy Laboratory). 2019. 2019 Annual Technology Baseline. Golden, CO: National Renewable Energy Laboratory.
As outlined in the graph above, wind, natural gas and utility-scale solar are the current cost leaders, with hydropower continuing to be competitive in some areas. Two generation stalwarts, coal and nuclear, have fallen significantly behind in terms of cost competitiveness. Natural gas, wind and solar are poised to be the dominant generation technologies of the coming decade.
How to Apply LCOE Data to Your Business
The emergence of cost competitive renewable technologies is already changing the dynamics that set hourly energy prices. Wind and sun are free, so with almost no marginal cost to run, these technologies are always the first ones called upon. It is becoming increasingly common for markets to see periods of very low energy prices when demand is not too high and wind and/or sun are plentiful.
As an energy consumer, if you’ve ever wondered about renewable energy in the past or looked at costs – it’s time to look again. Renewable energy, especially when produced at a utility scale, can often be supplied at a discount to conventional generation in many areas. Many businesses are able to meet both sustainability and risk management goals with a tailored renewable procurement strategy.
If you are interested in learning more about the generation landscape or how your company might take advantage of low renewable energy costs, click HERE. If you are already working with an AEP Energy sales representative, they will happily provide more information about this approach.
Want to receive our Customer Insights as soon as they are published?
Subscribe to blog today to have them sent directly to your inbox as soon as they are published.
AEP Energy does not guarantee the accuracy, timeliness, suitability, completeness, freedom from error, or value of any information herein. The information presented is provided “as is”, “as available”, and for informational purposes only, speaks only to events or circumstances on or before the date it is presented, and should not be construed as advice, a recommendation, or a guarantee of future results. AEP Energy disclaims any and all liabilities and warranties related hereto, including any obligation to update or correct the information herein. Summaries and website links included herein (collectively, “Links”) are not under AEP Energy’s control and are provided for reference only and not for commercial purposes. AEP Energy does not endorse or approve of the Links or related information and does not provide any warranty of any kind or nature related thereto.
As energy markets evolve, understanding the forces behind your electricity costs is more important than ever. AEP Energy’s Understanding Capacity Series is a must-watch for businesses looking to stay ahead of the curve and make informed energy decisions in the face of rising capacity costs. What’s in the Series? This insightful video series features AEP …
3 min read Let’s talk about something that’s making waves in the energy sector: demand management. Specifically, how it can help businesses navigate the rising capacity prices in PJM. Whether you’re a business owner or an operations manager, you’ll want to pay attention to this. What is Demand Management? Demand management is a strategy where …
Enter your zip code to see energy plans in your area
Already an AEP energy customer?Login to view account details or enroll at the same rate as new customers.
We found several utilities in your area! Please select yours below:
AEP Energy Reward Store is filled with a variety of energy-saving products for your home. It is a simple and convenient way for you to shop for items to make your home more energy efficient while saving you time and money.
Collect Reward Dollars each month ($5/electric, $3/natural gas) for simply being an AEP Energy Customer.
Shop AEP Energy Reward Store for energy-efficient products like smart thermostats, LED lighting, and more.
Redeem your accumulated Reward Dollars and enjoy smart solutions for your home.