Energy Market Report
Jul 21, 2026
Recent Developments in Today’s Market
Bullish – Bearish statement provided by AEP Energy Trading
Monday July 20 – A cooler weather forecast weighed on PJM cash prices, with term markets also moving lower. In Texas, near-term power prices increased as above-normal temperatures moved into the region.
Friday July 17 – After declining for much of the week, power prices moved higher ahead of the weekend. Forecasts continue to indicate above-normal temperatures from July 20–31, providing support for balance-of-week, next-week, and prompt-month power markets.
MISO/PJM Hourly Day-Ahead LMP
Source: LMP data courtesy of MISO and PJM; used with permission
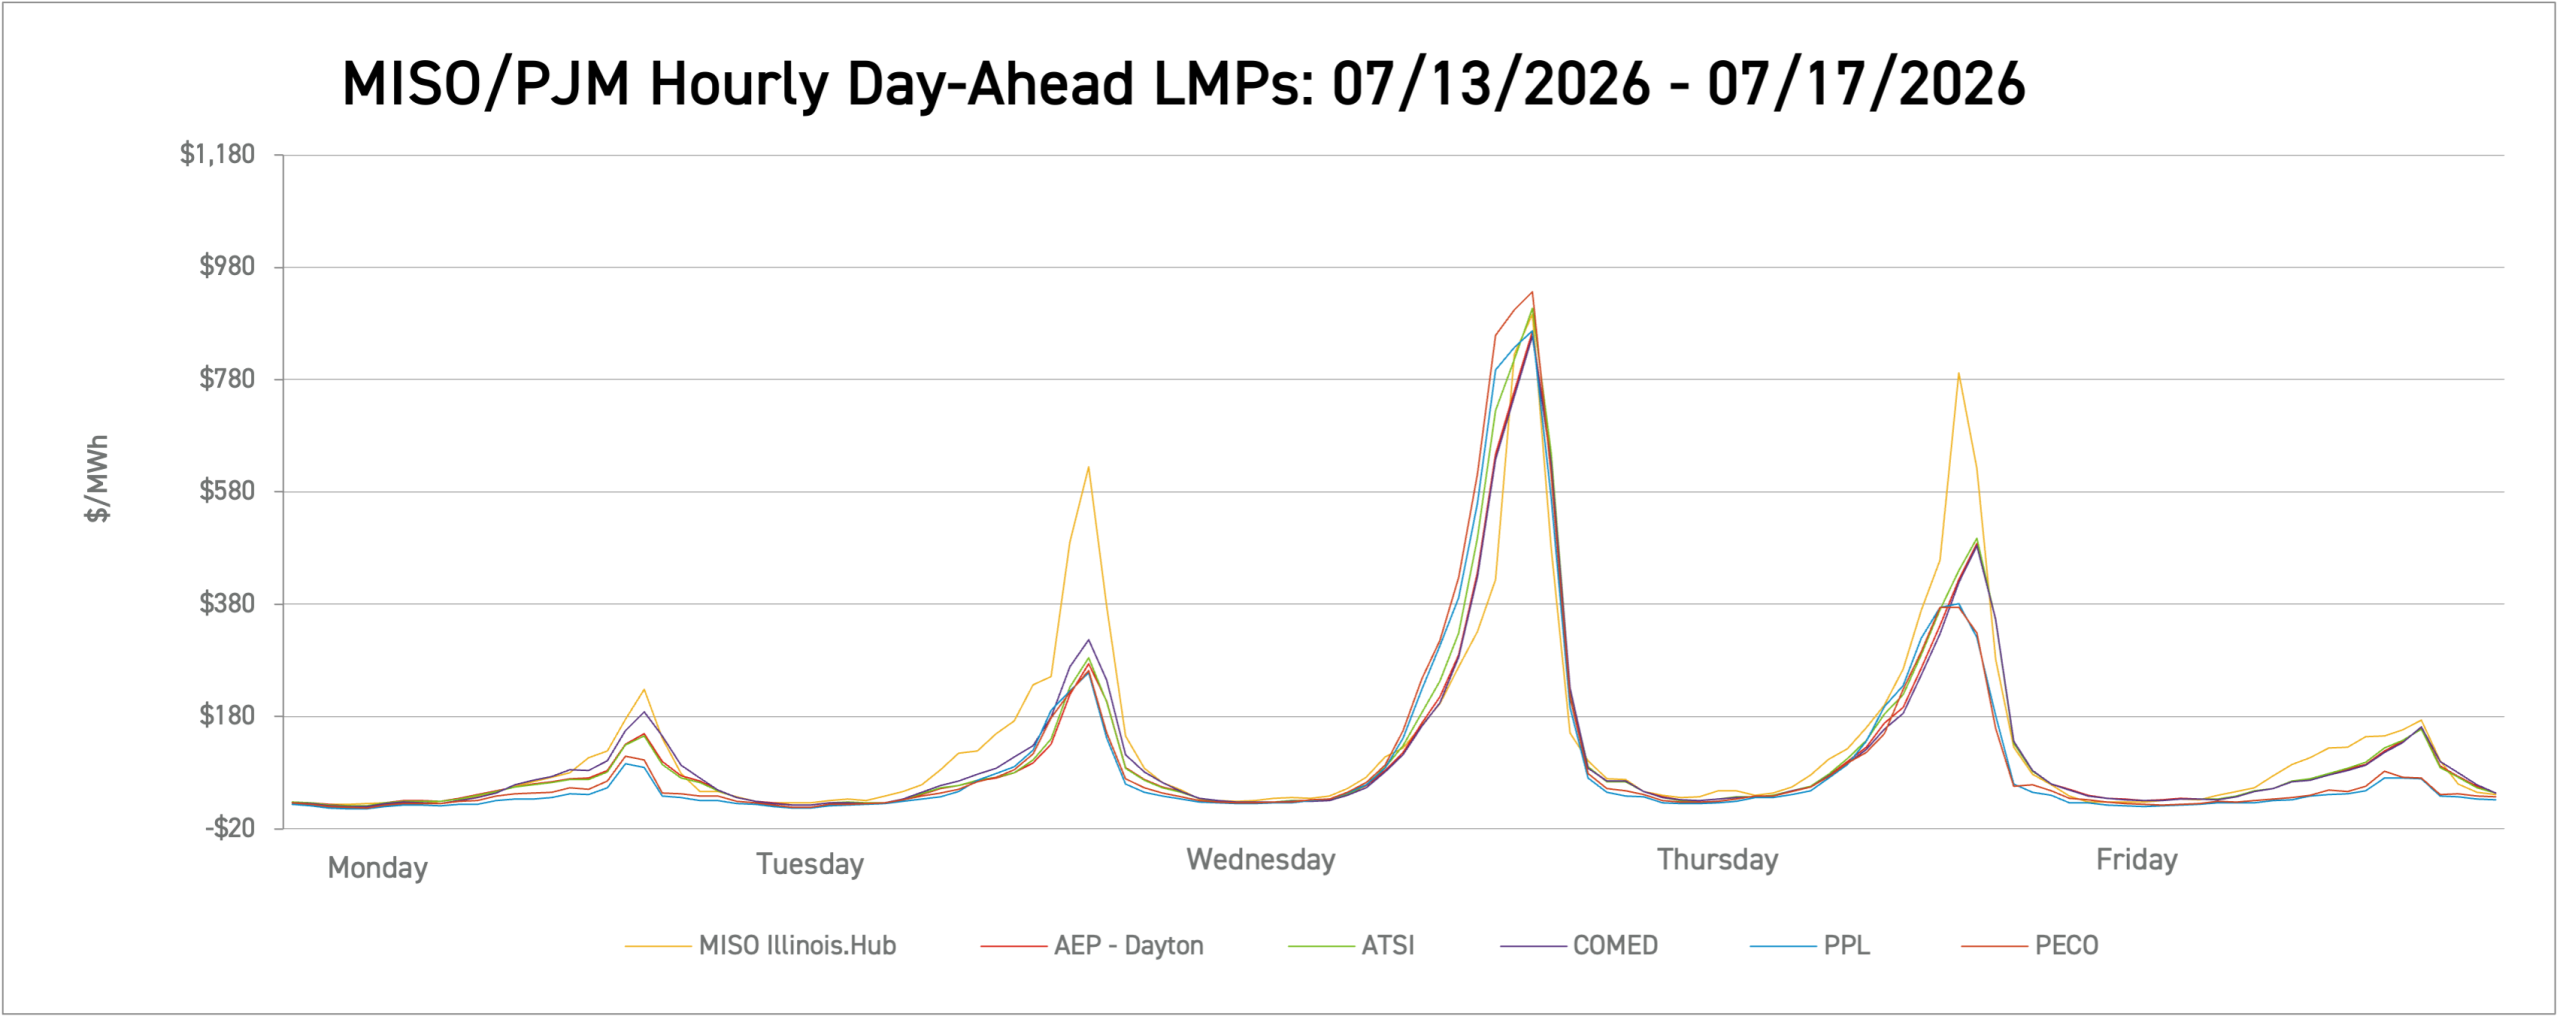
*Graphs are for illustrative purposes only; LMPs priced in Central Prevailing Time (CPT)
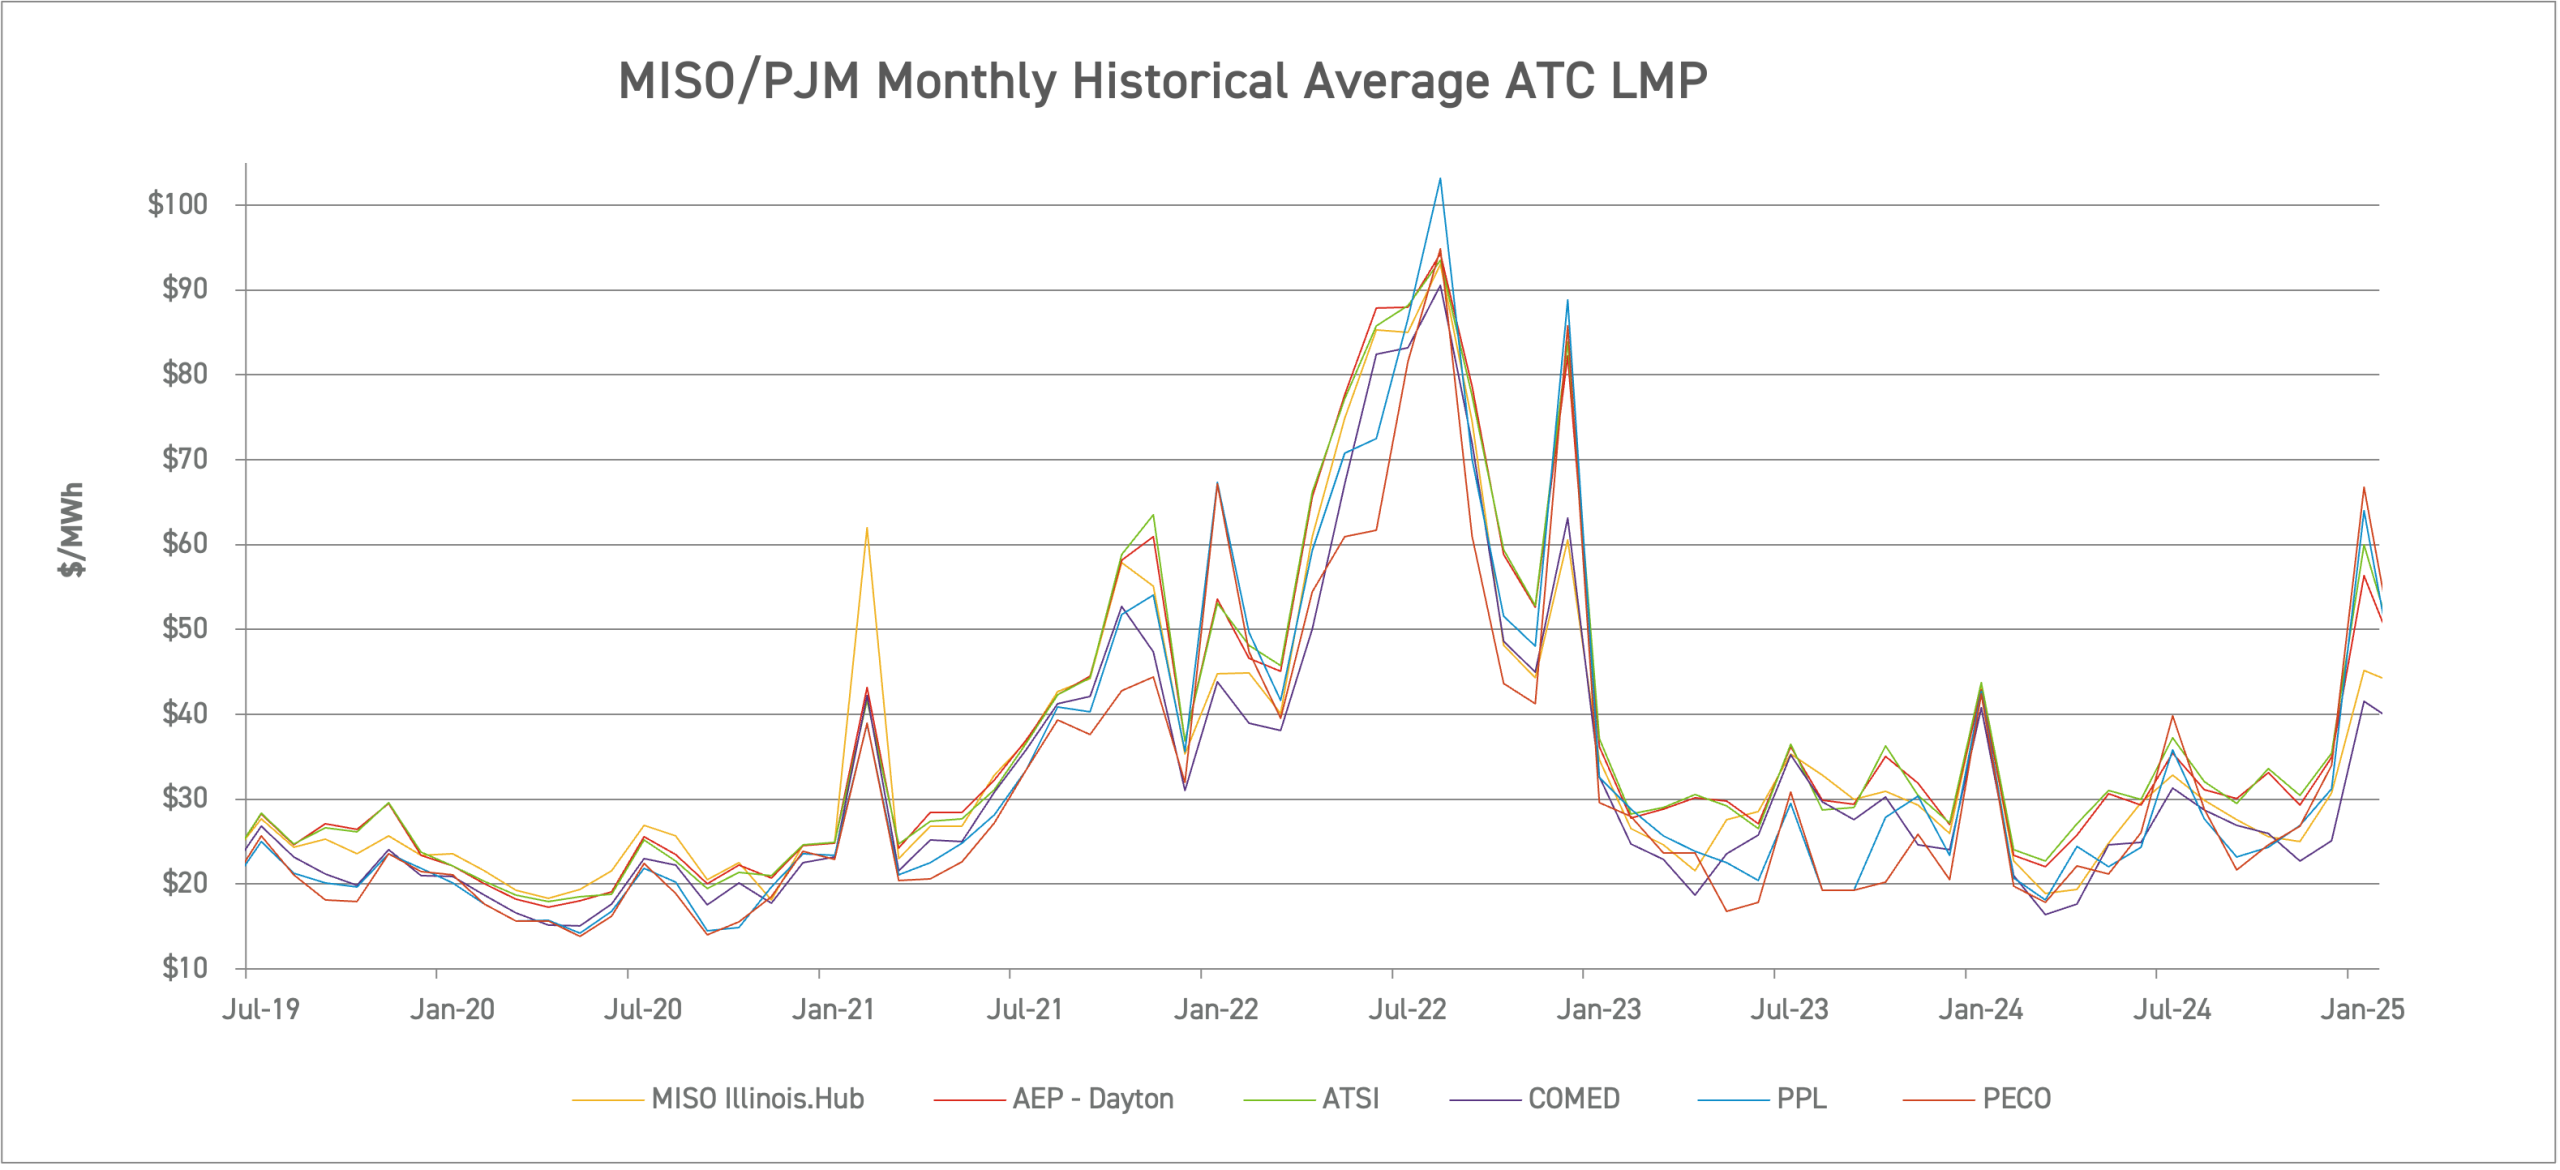
MISO/PJM Monthly Historical Around-the-Clock (ATC) LMP
Source: LMP data courtesy of MISO and PJM; used with permission
AD Hub Electricity vs. Henry Hub Natural Prices
Source: AEP Energy internal estimates
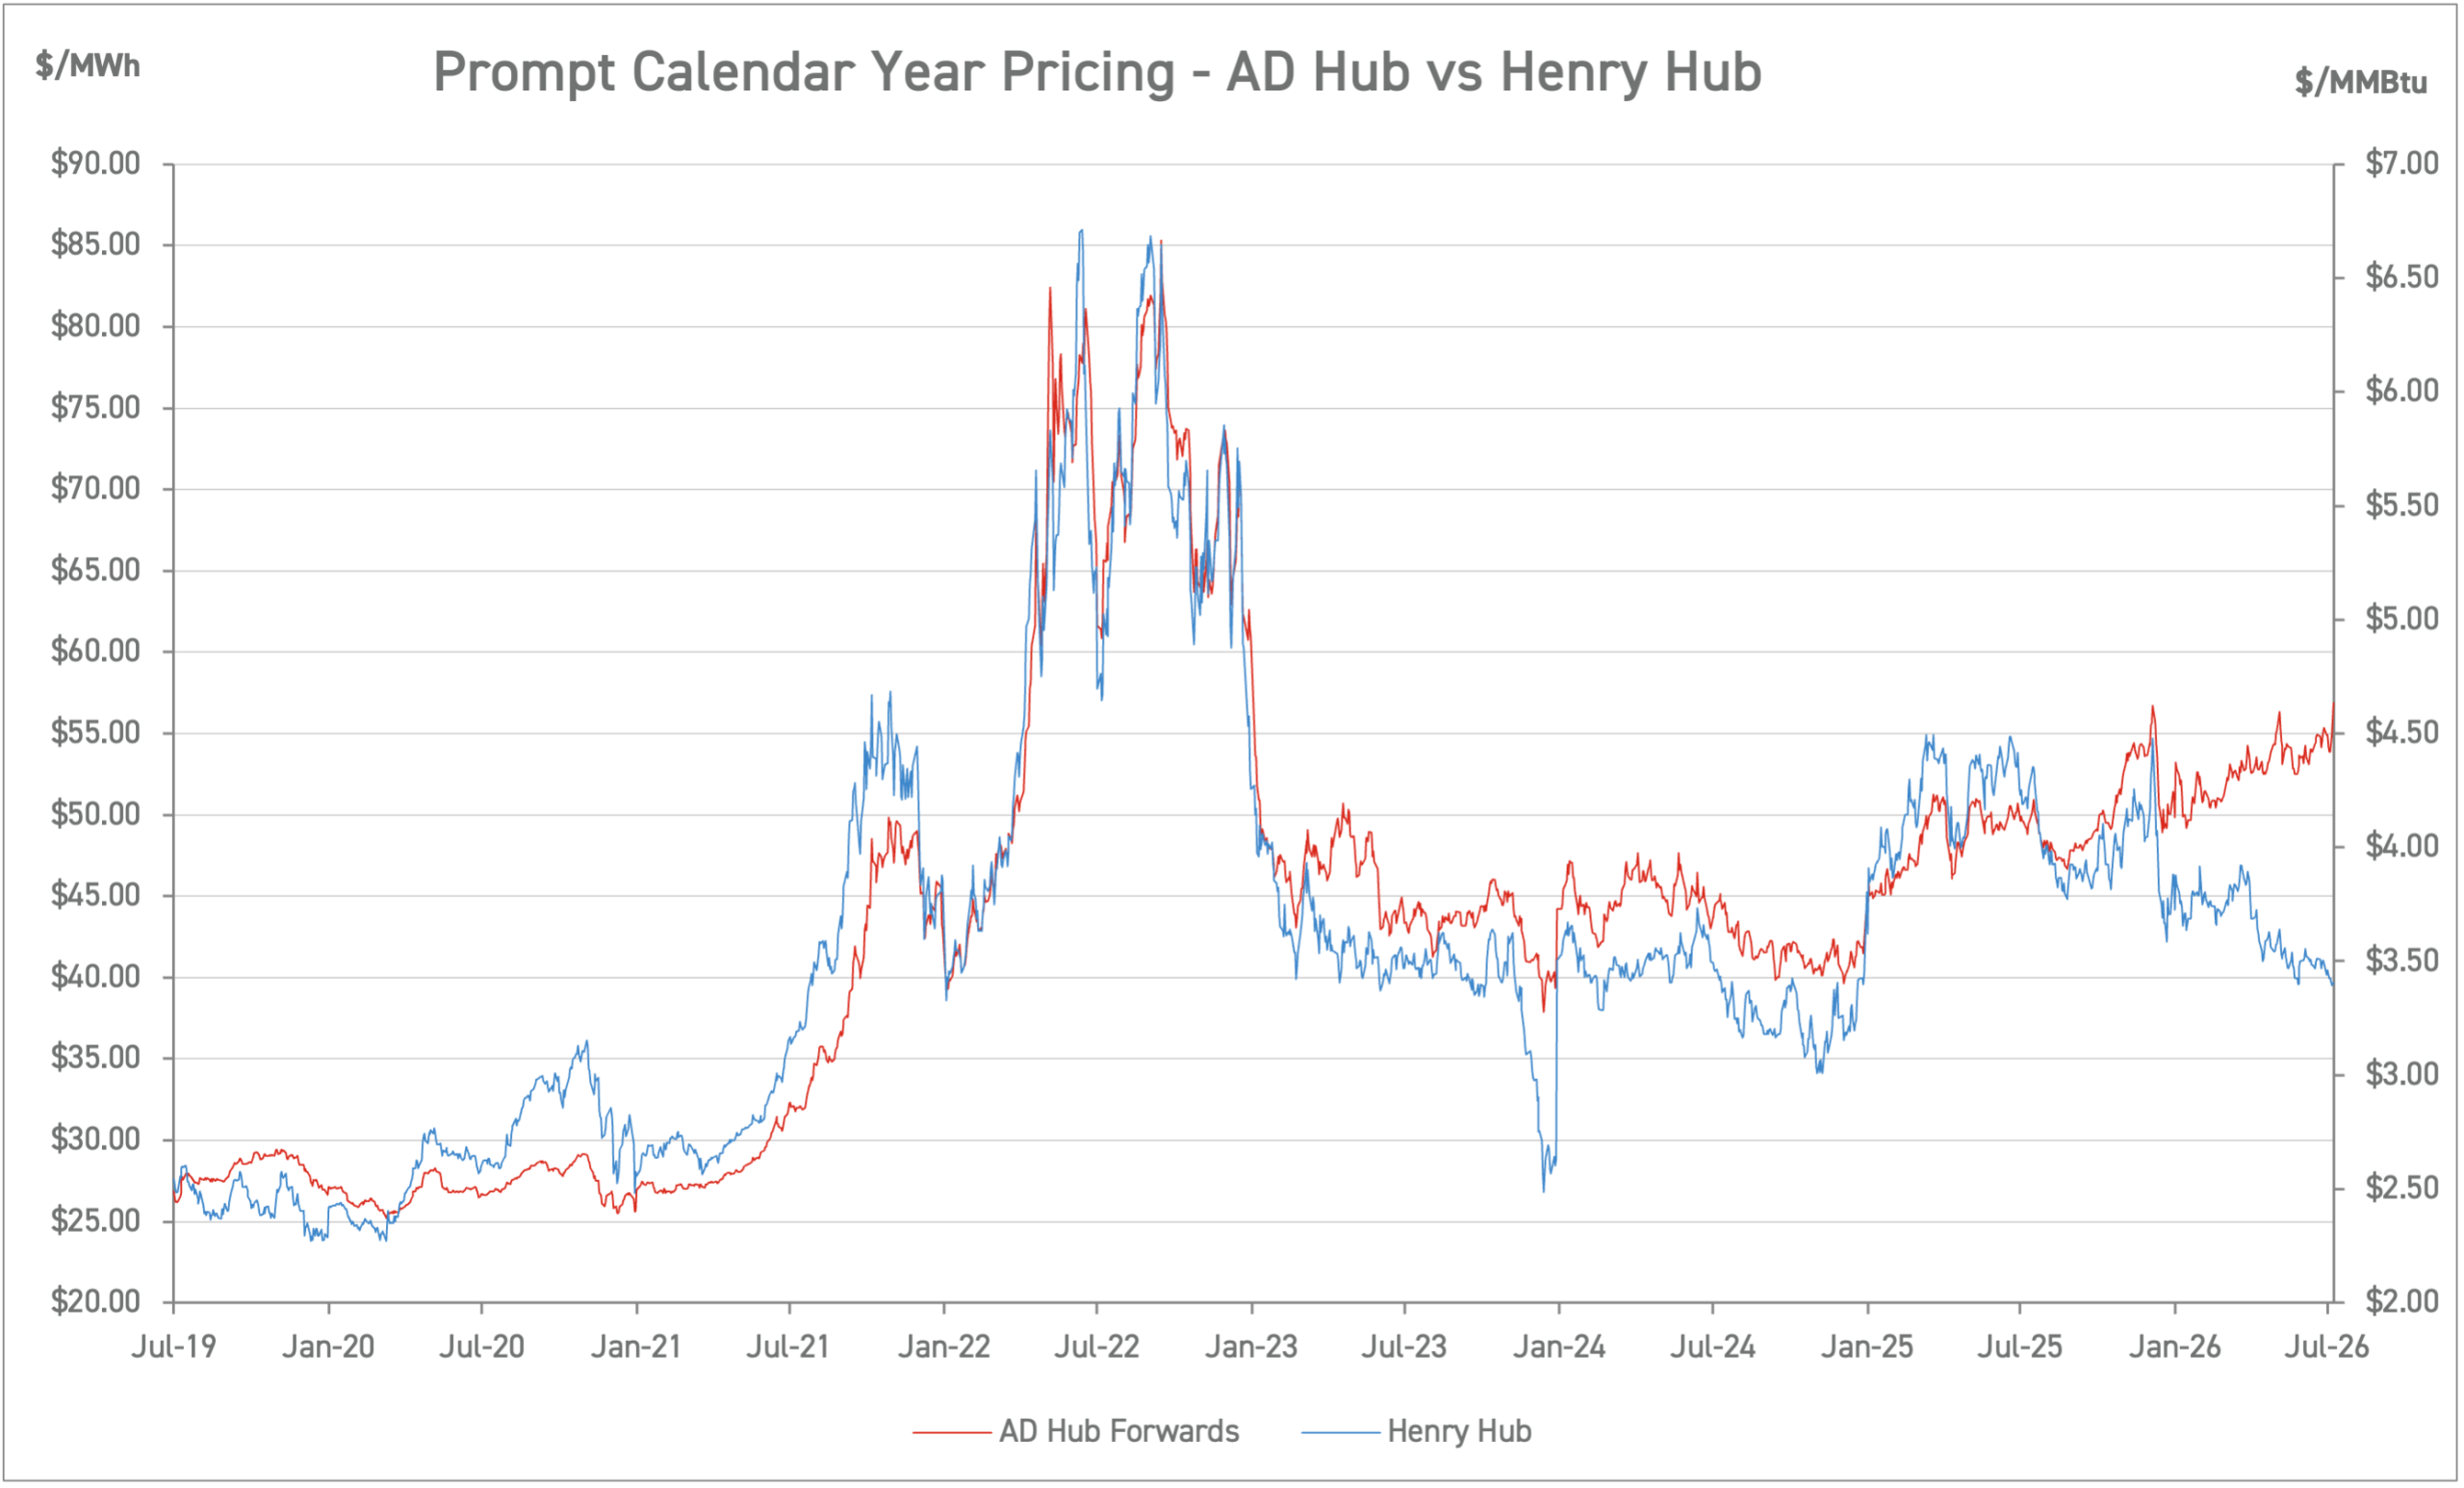
*Graph is for illustrative purposes only; AD Hub priced in Eastern Standard Time (EST)
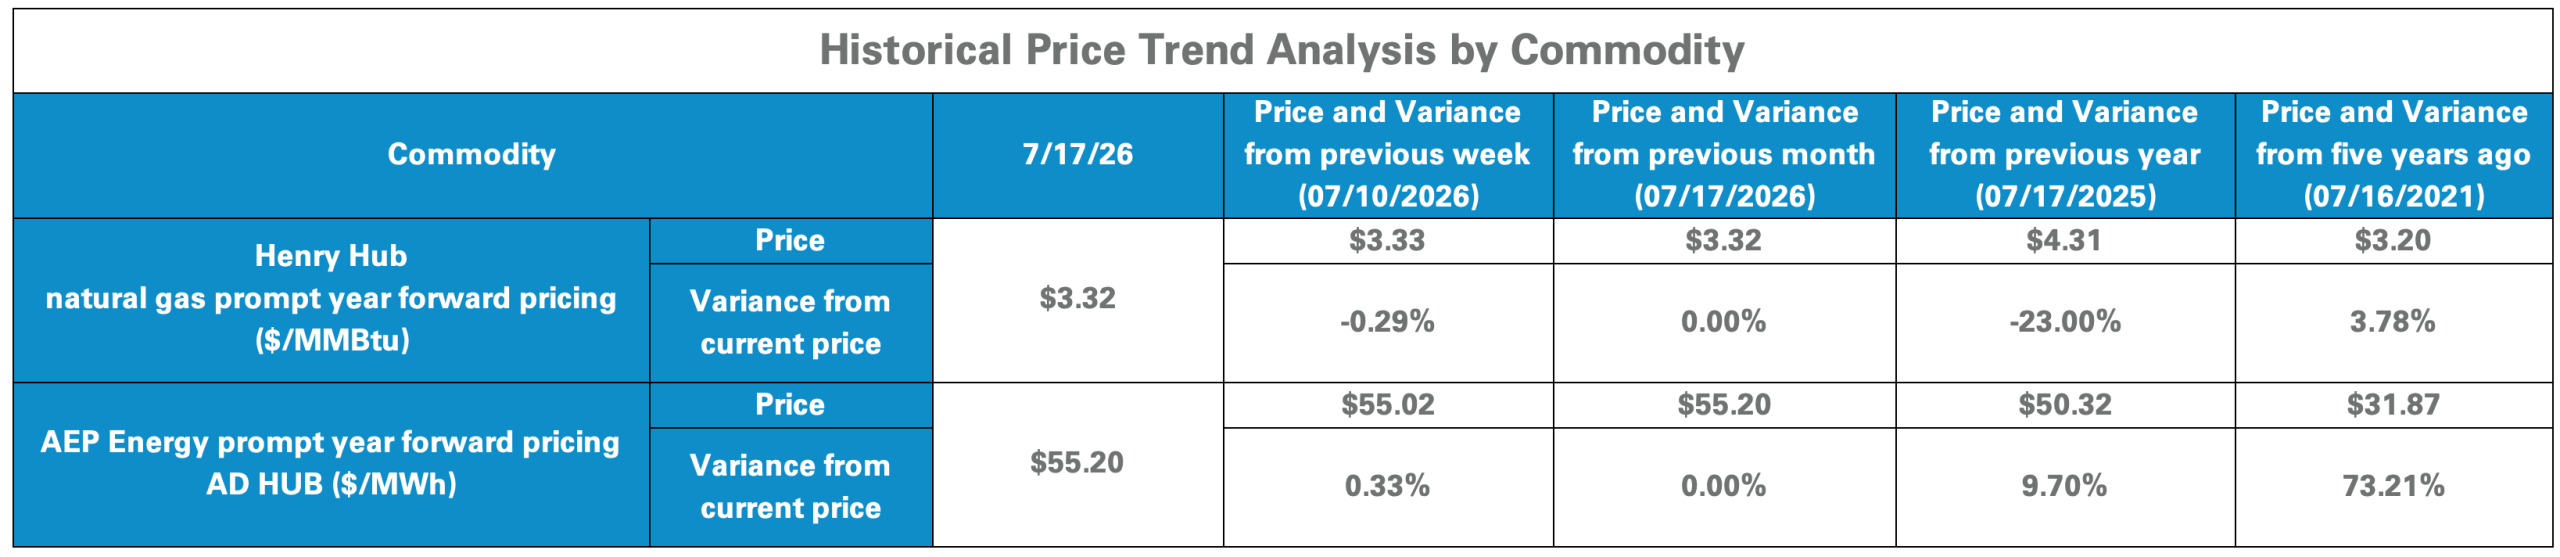
Historic Trend Analysis by Commodity
AEP – DAYTON (AD) Hub Around-the-Clock (ATC)
Source: AEP Energy internal estimates
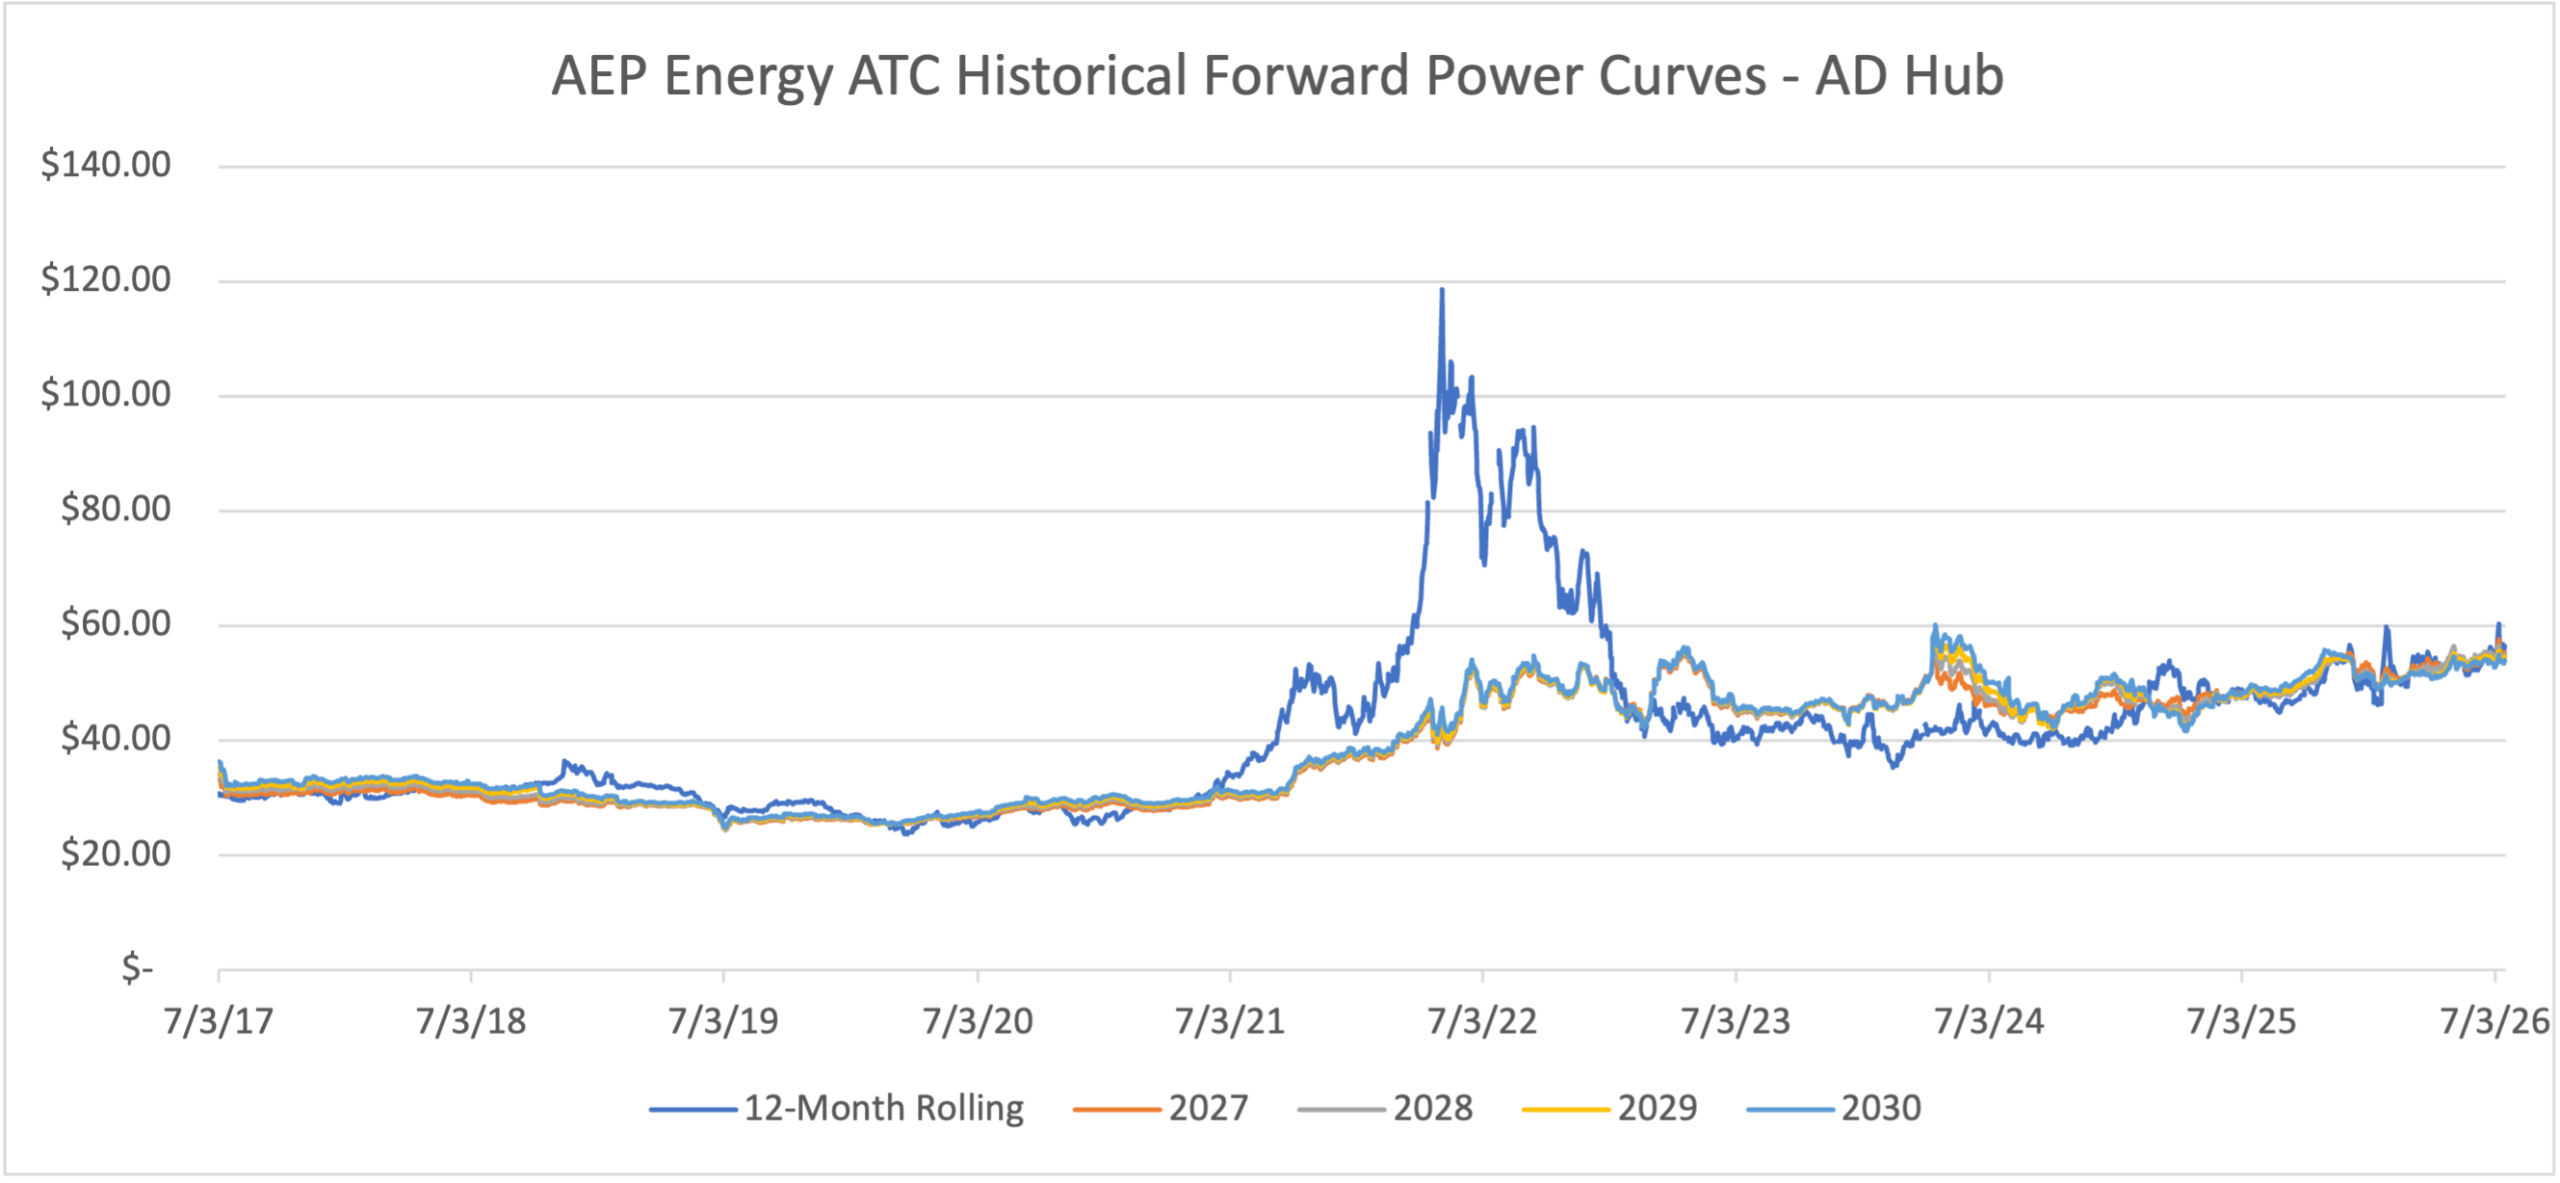
*Graph is for illustrative purposes only. AD Hub priced in Eastern Standard Time (EST)
AD Hub ATC Forward Price Trend Analysis
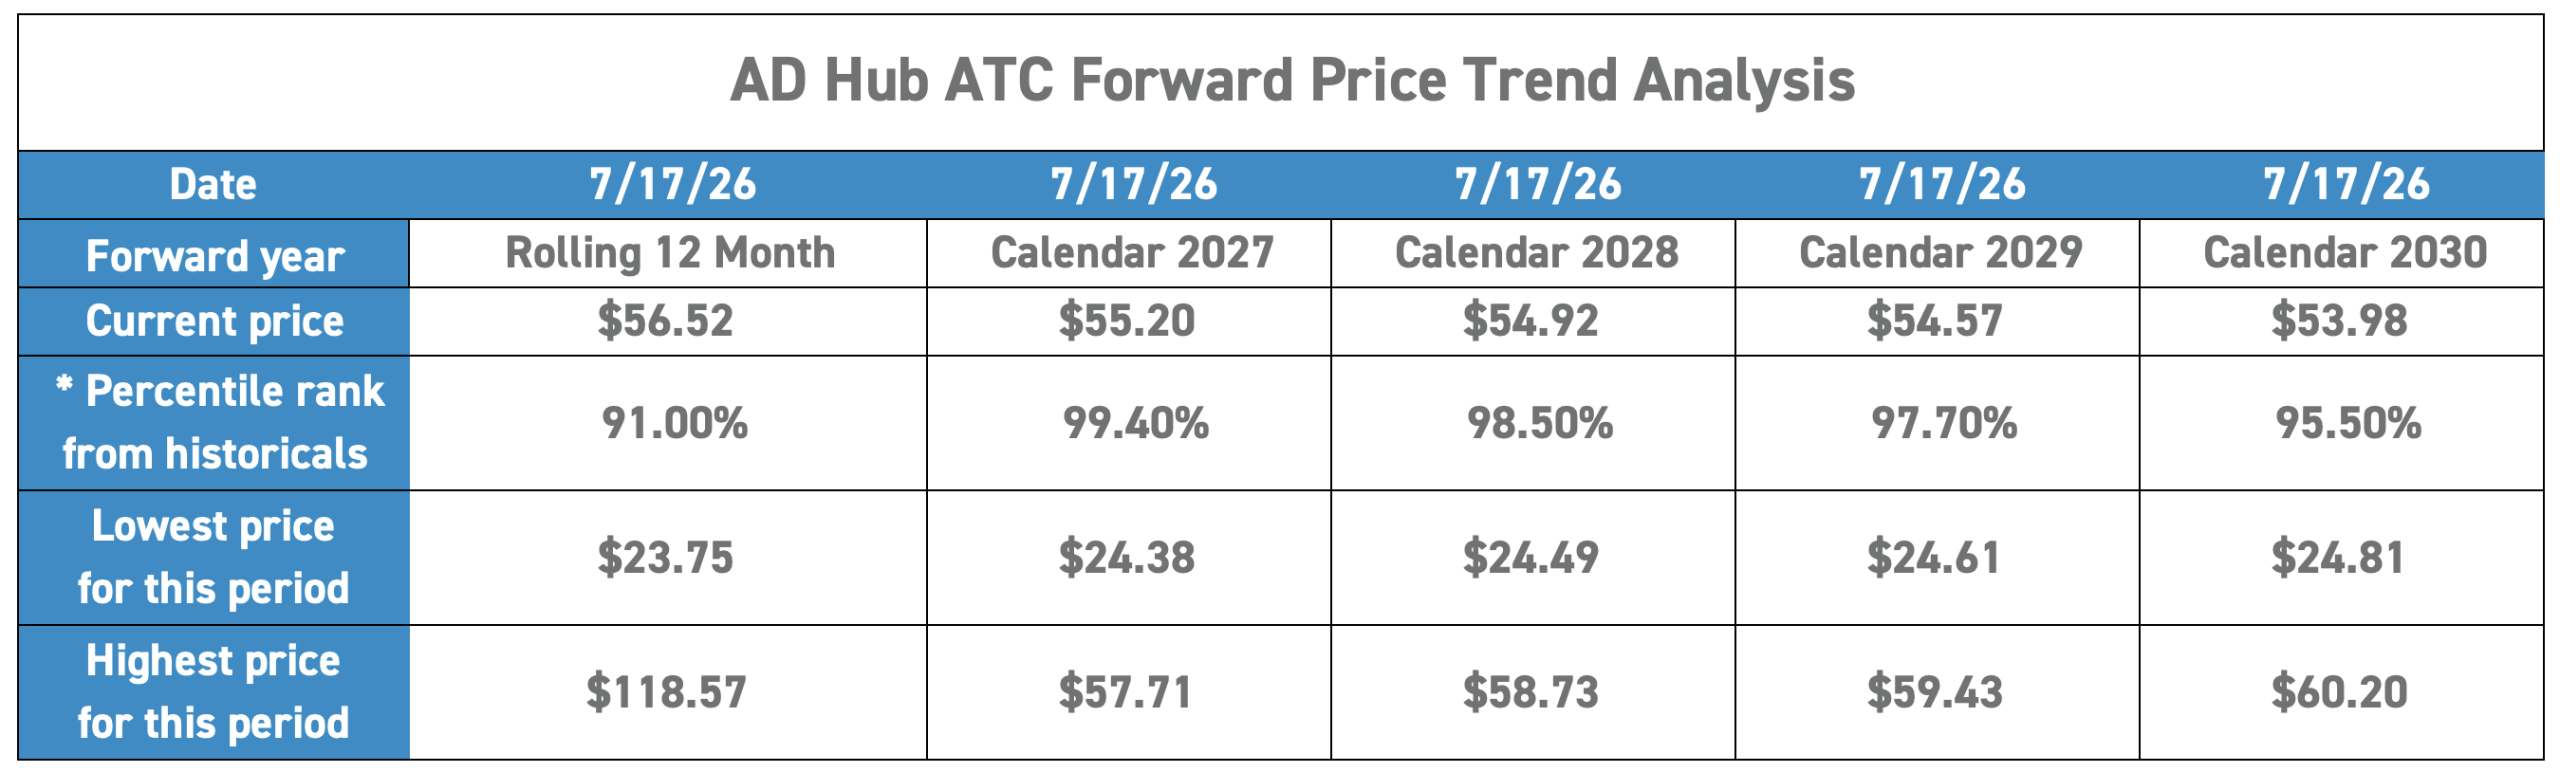
*Percentile rank from historicals represents the relation of current price and how it compares to historical pricing. For Calendar 2028, 98.5% indicates that the current price is lower than 1.5% of historical pricing dating back to July 2017.
AEP – DAYTON (AD) Hub On-Peak
Source: AEP Energy internal estimates
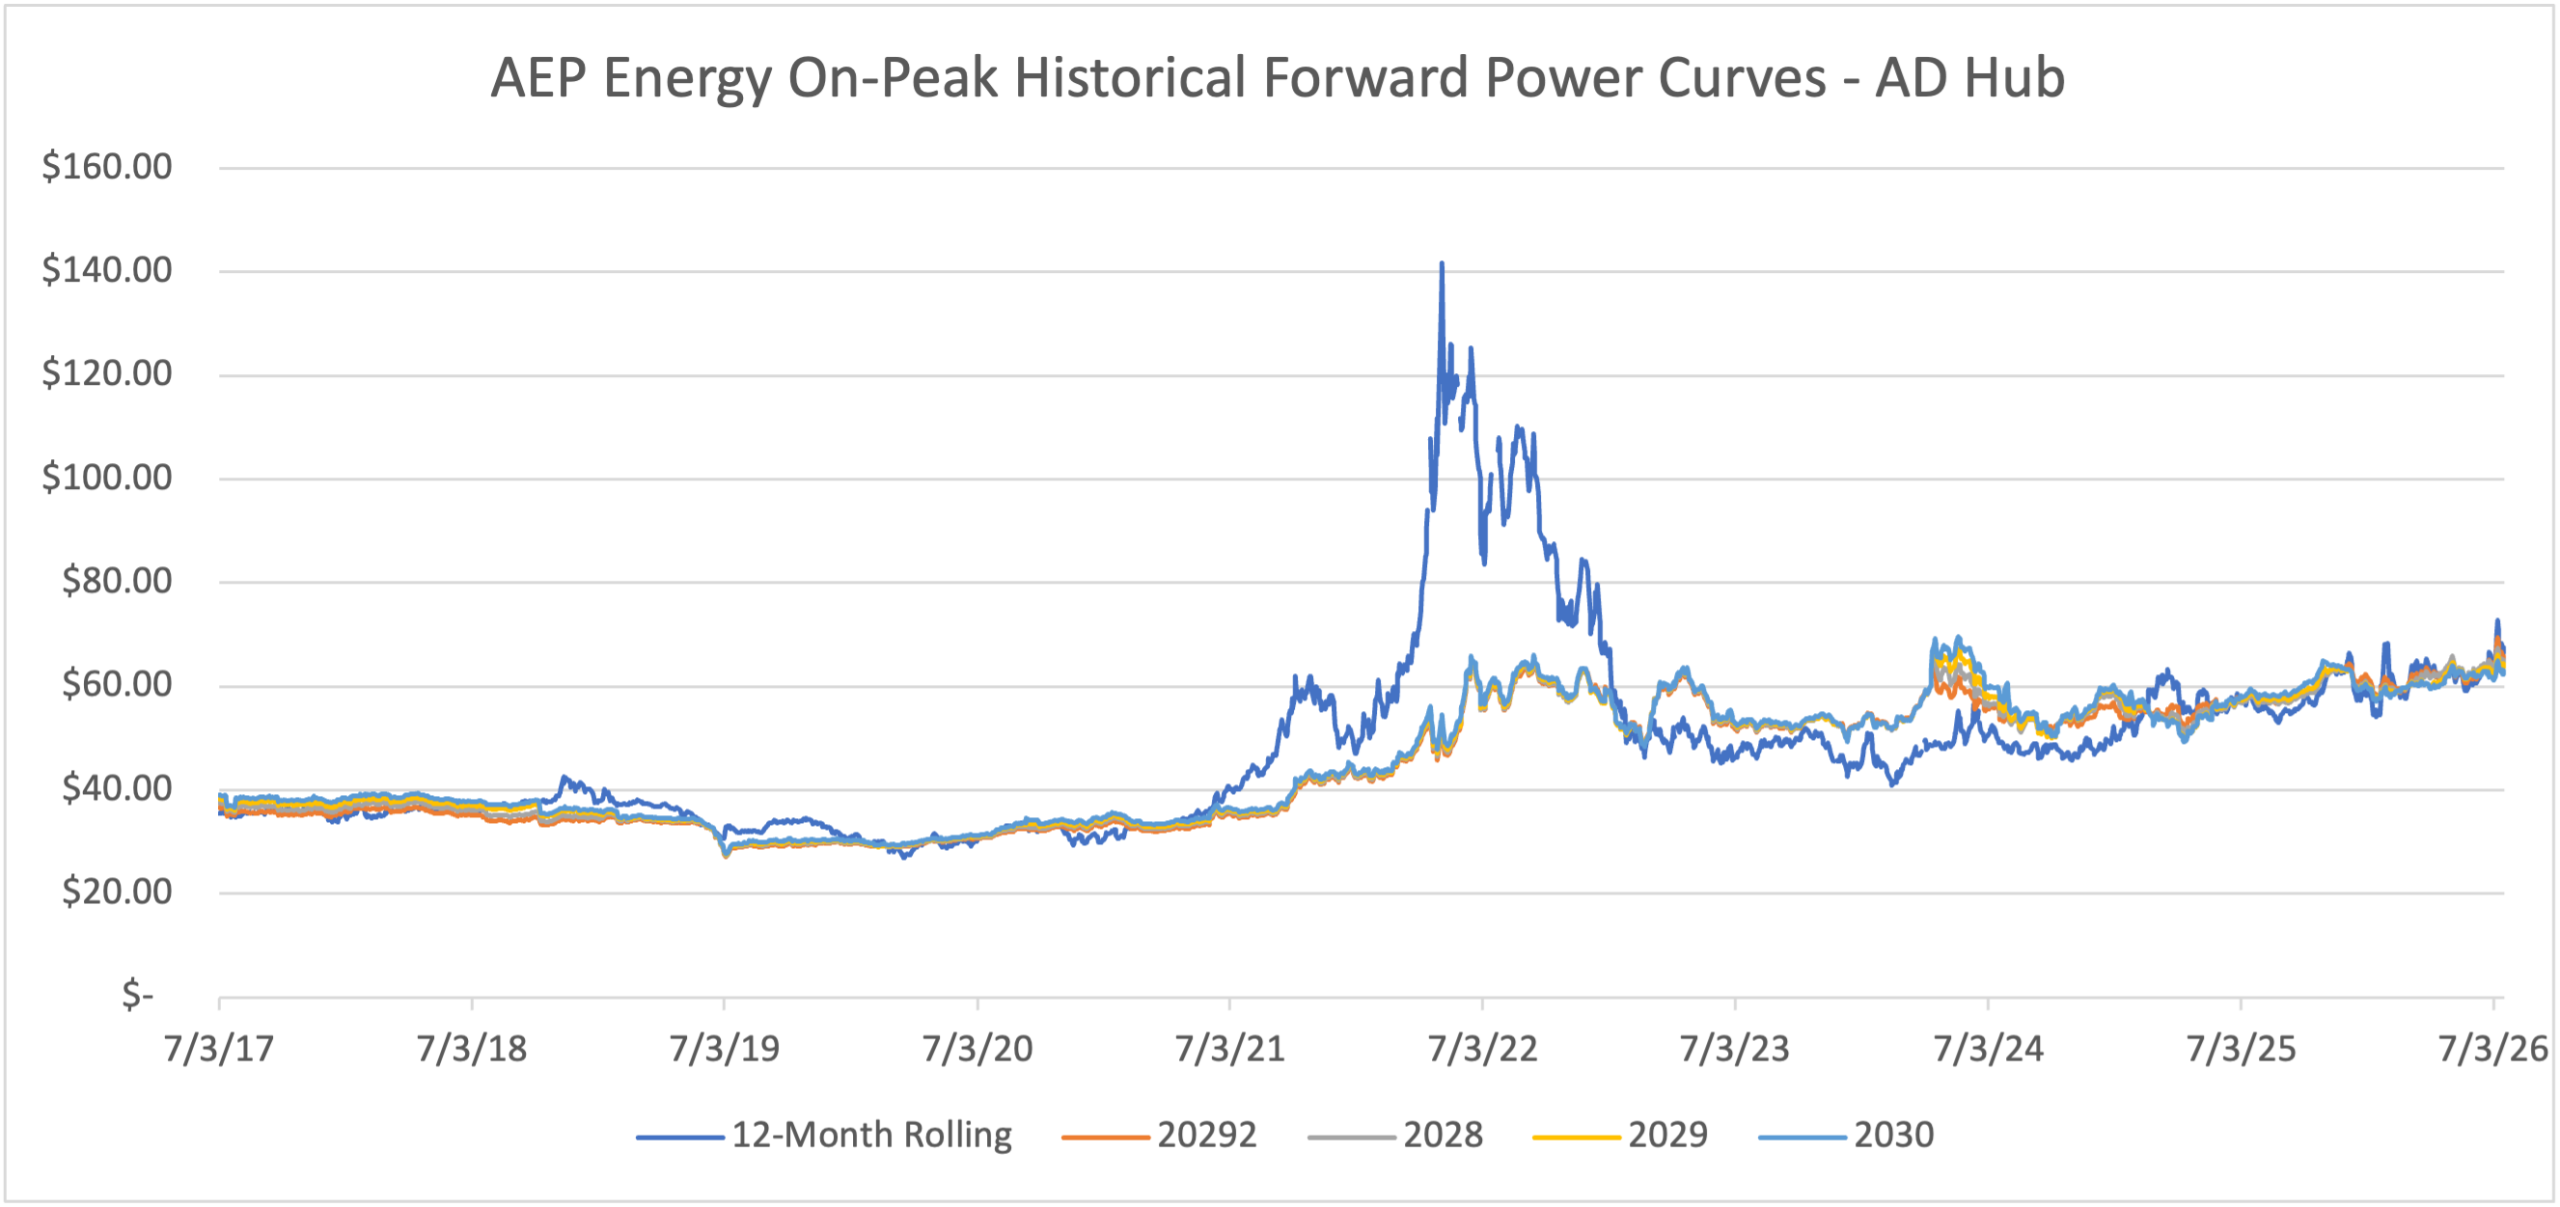
AD Hub On-Peak Forward Price Trend Analysis
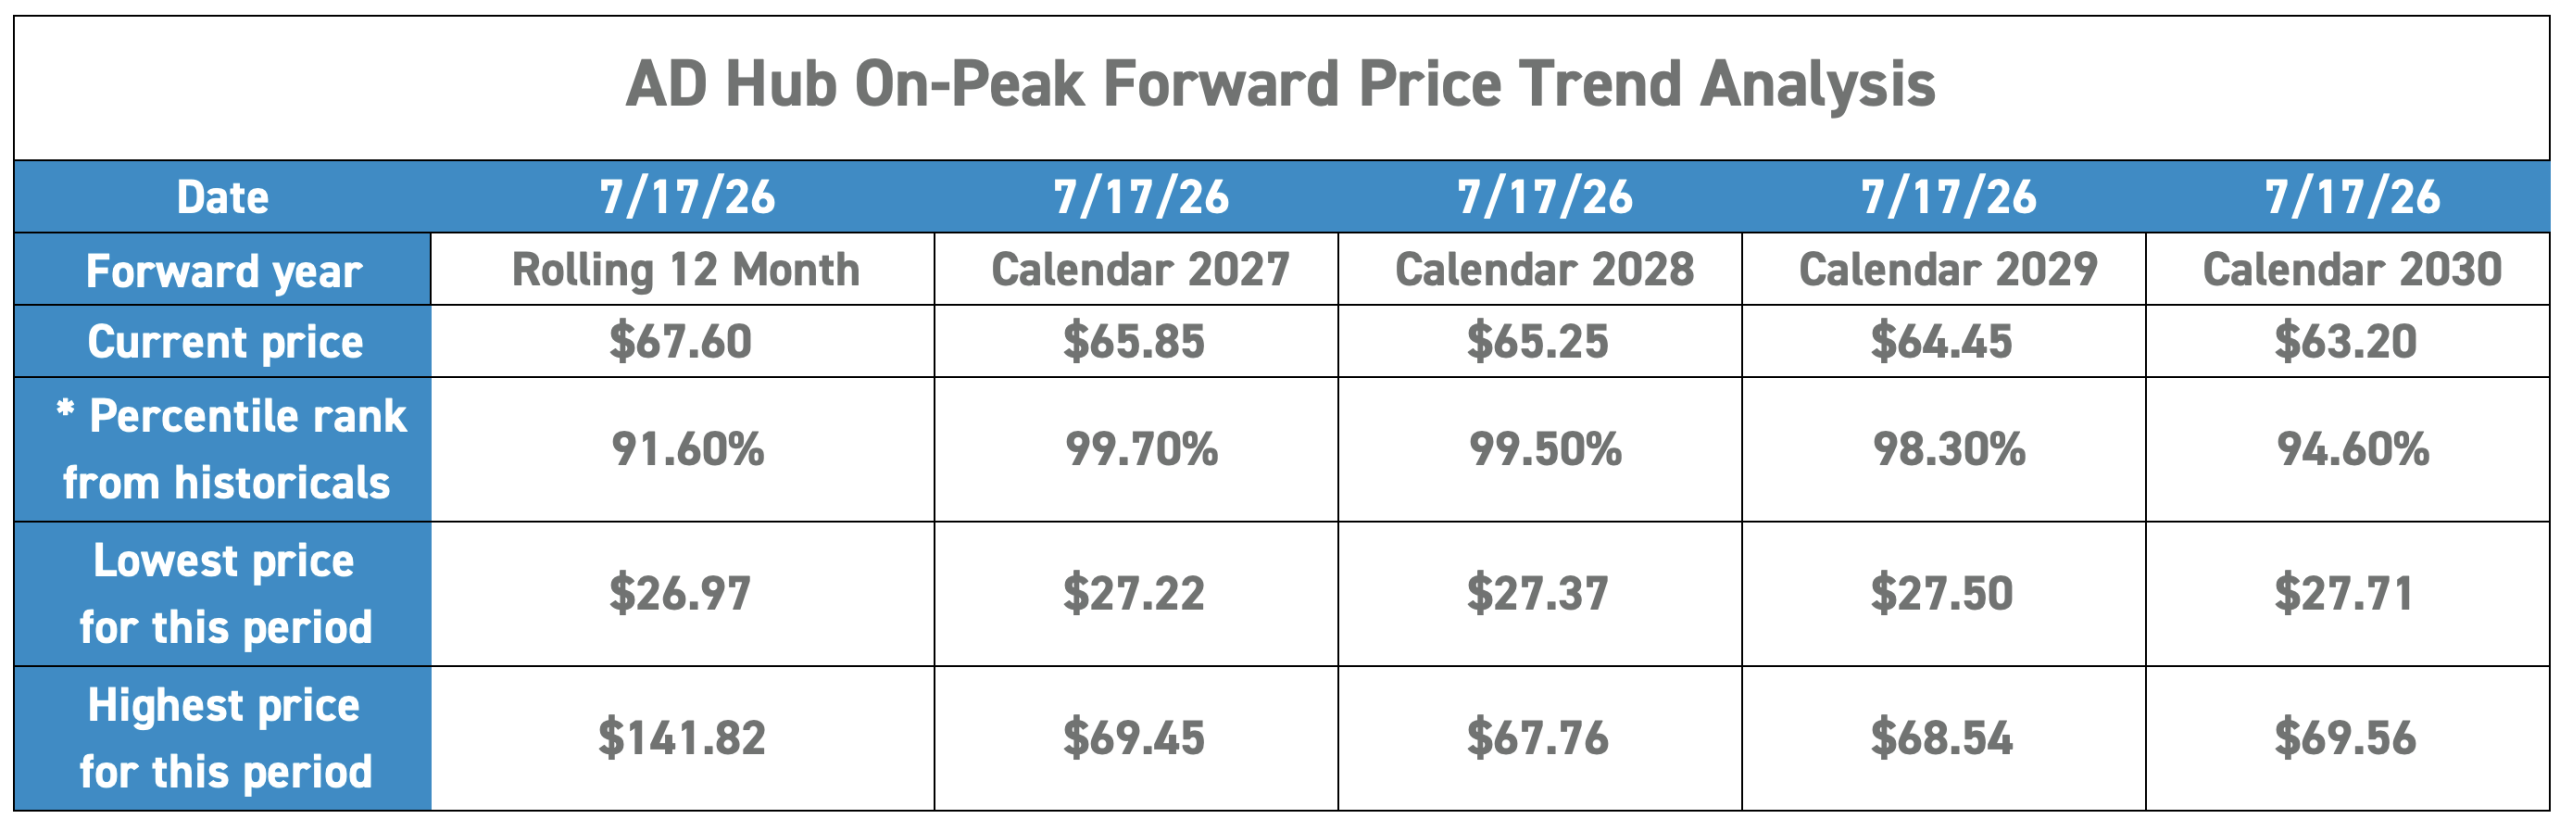
*Percentile rank from historicals represents the relation of current price and how it compares to historical pricing. For Calendar 2028, 99.5% indicates that the current price is lower than 0.5% of historical pricing dating back to July 2017.
Northern Illinois (NI) Hub Around-the-Clock (ATC)
Source: AEP Energy internal estimates
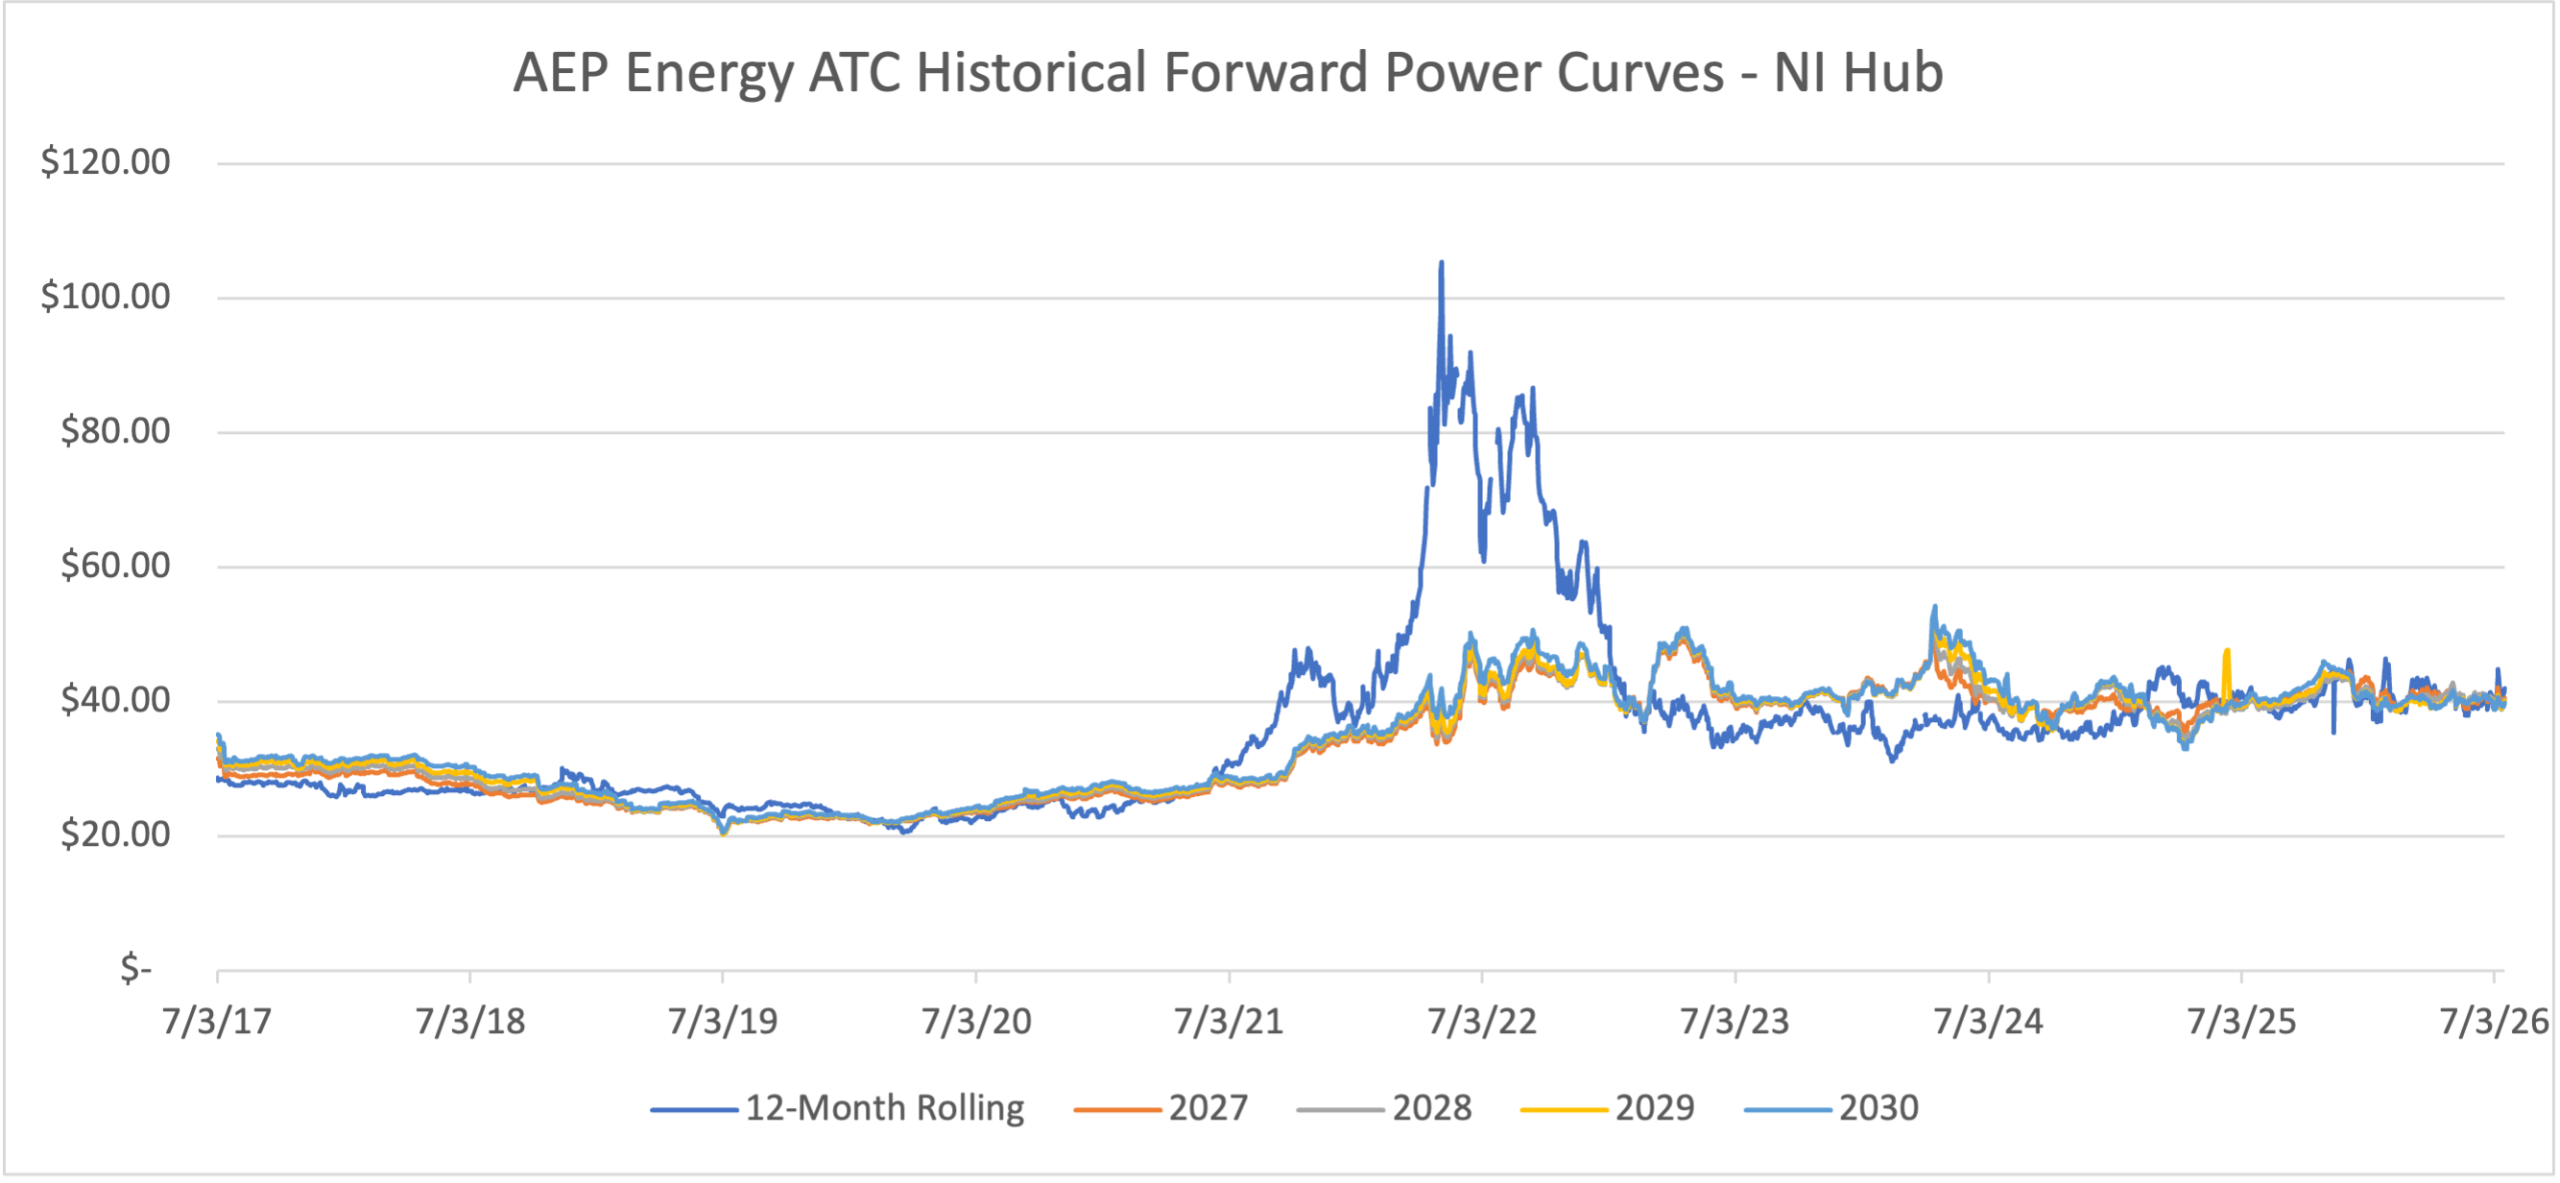
*Graph is for illustrative purposes only. NI Hub priced in Eastern Standard Time (EST)
NI Hub ATC Forward Price Trend Analysis
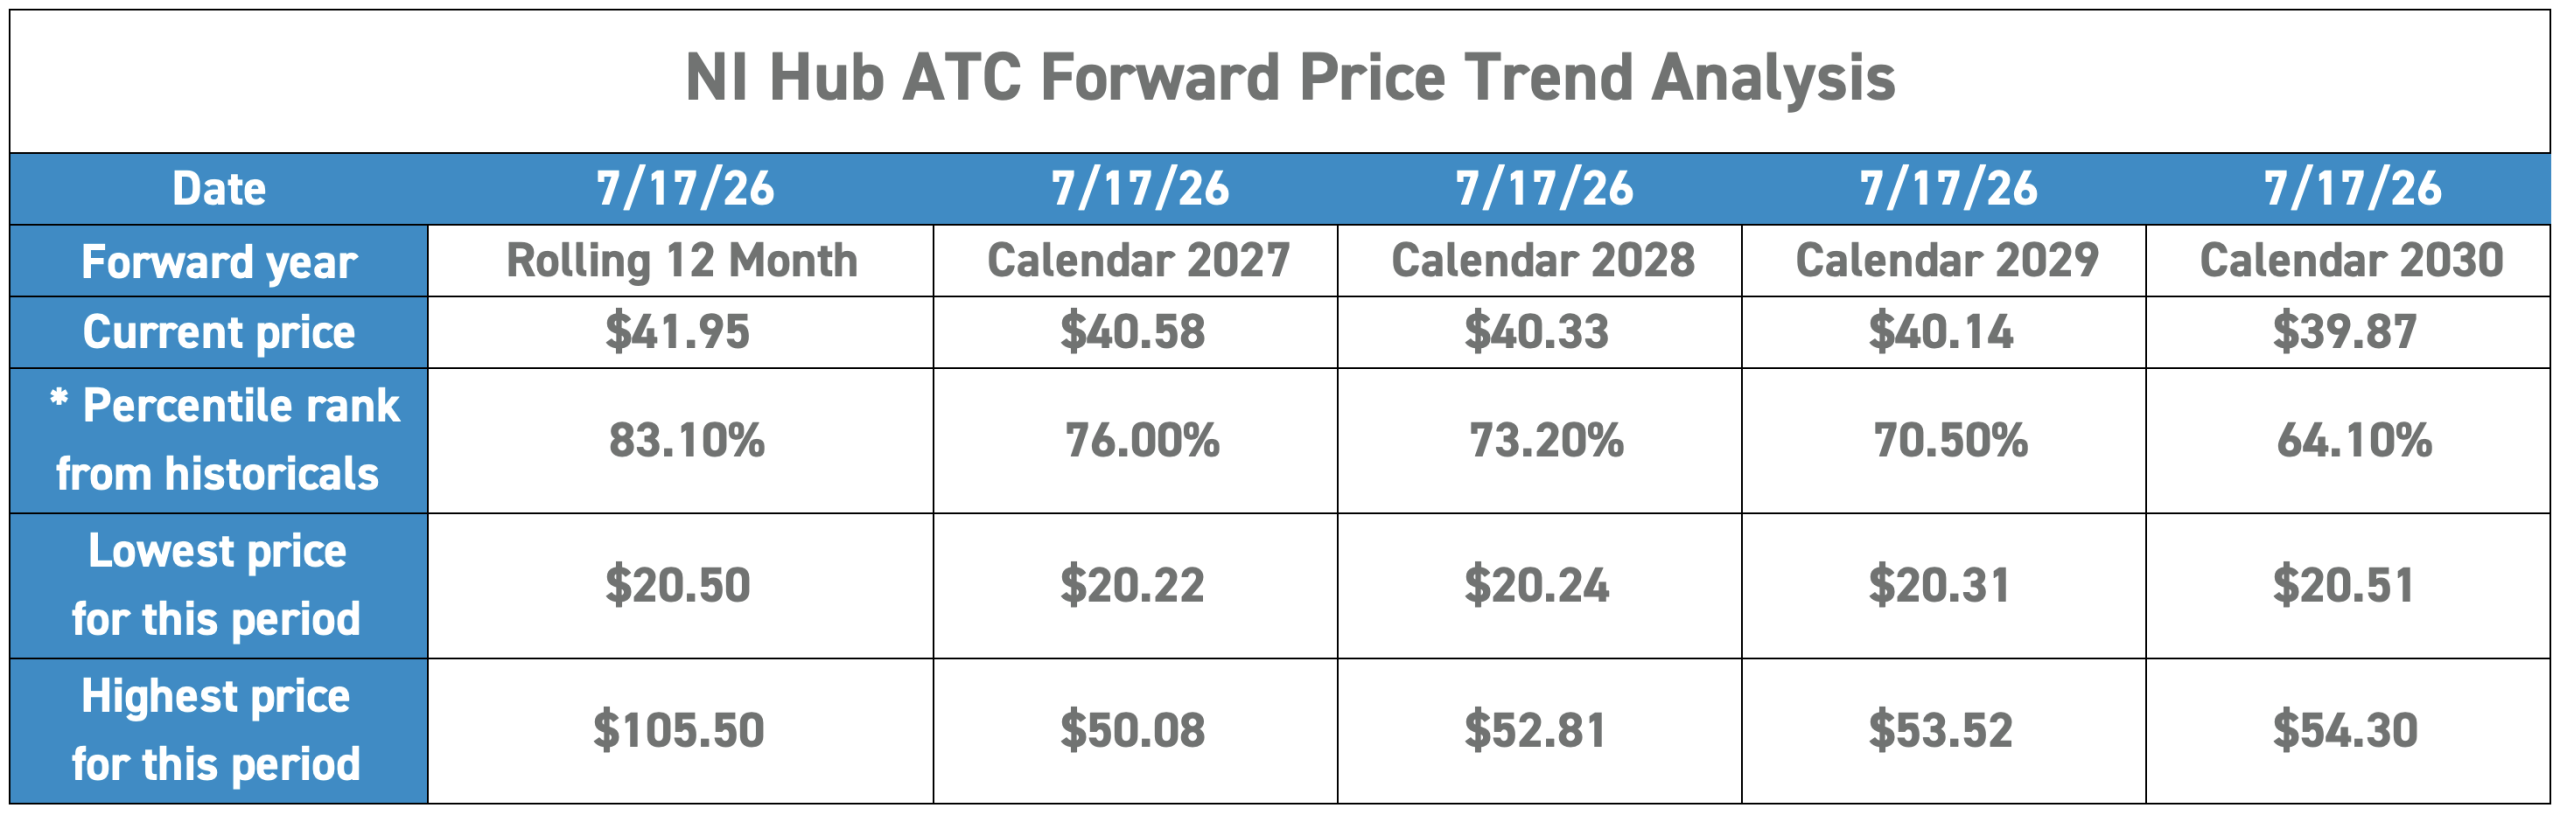
*Percentile rank from historicals represents the relation of current price and how it compares to historical pricing. For Calendar 2028, 73.2% indicates that the current price is lower than 26.8% of historical pricing dating back to July 2017.
Northern Illinois (NI) Hub On-Peak
Source: AEP Energy internal estimates
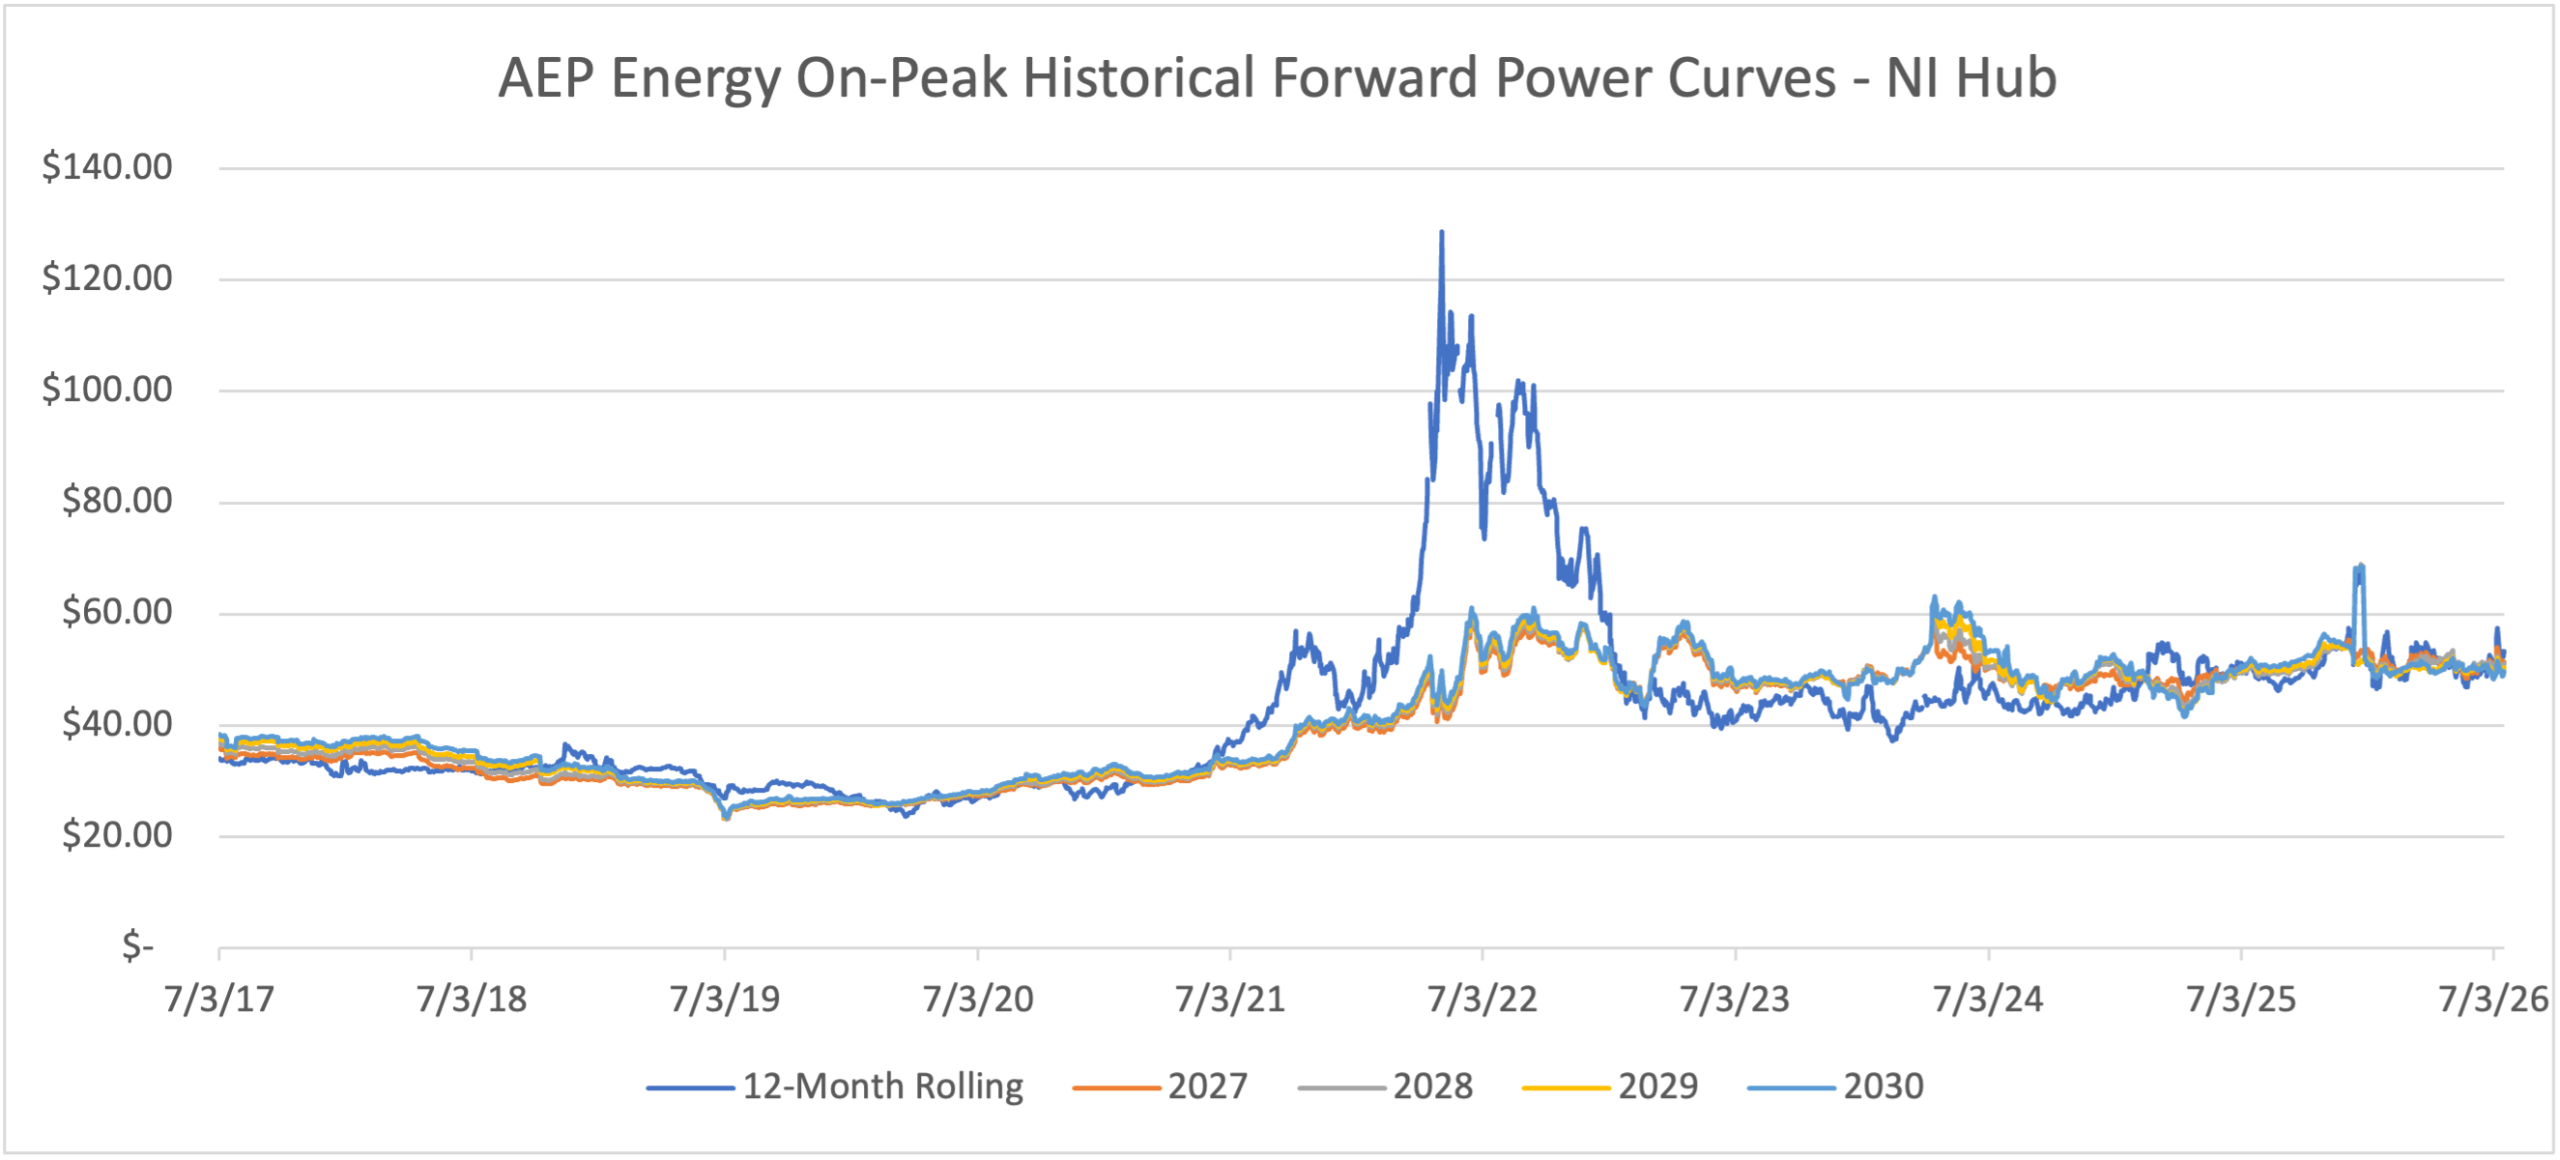
*Graph is for illustrative purposes only. NI Hub priced in Eastern Standard Time (EST)
NI Hub On-Peak Forward Price Trend Analysis
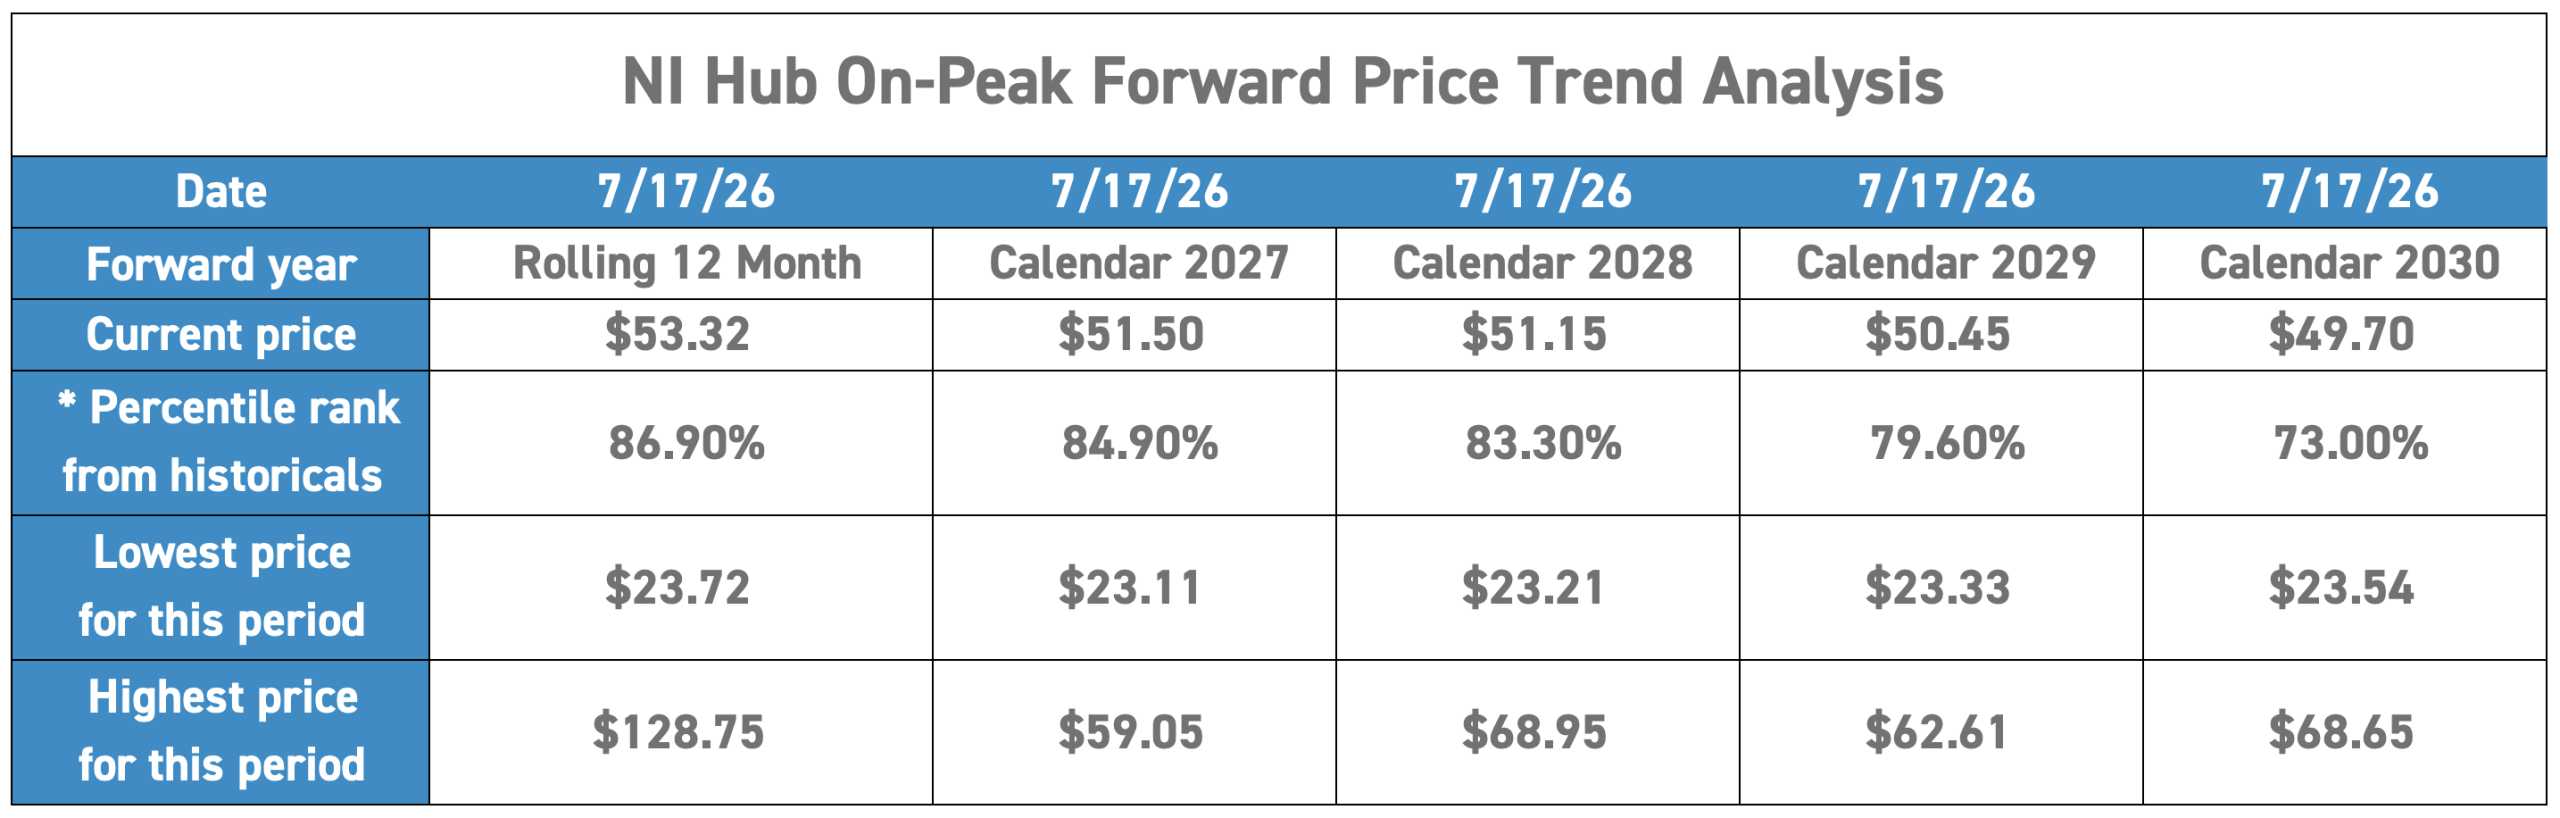
*Percentile rank from historicals represents the relation of current price and how it compares to historical pricing. For Calendar 2028, 83.3% indicates that the current price is lower than 16.7% of historical pricing dating back to July 2017.
Western (West) Hub Around-the-Clock (ATC)
Source: AEP Energy internal estimates
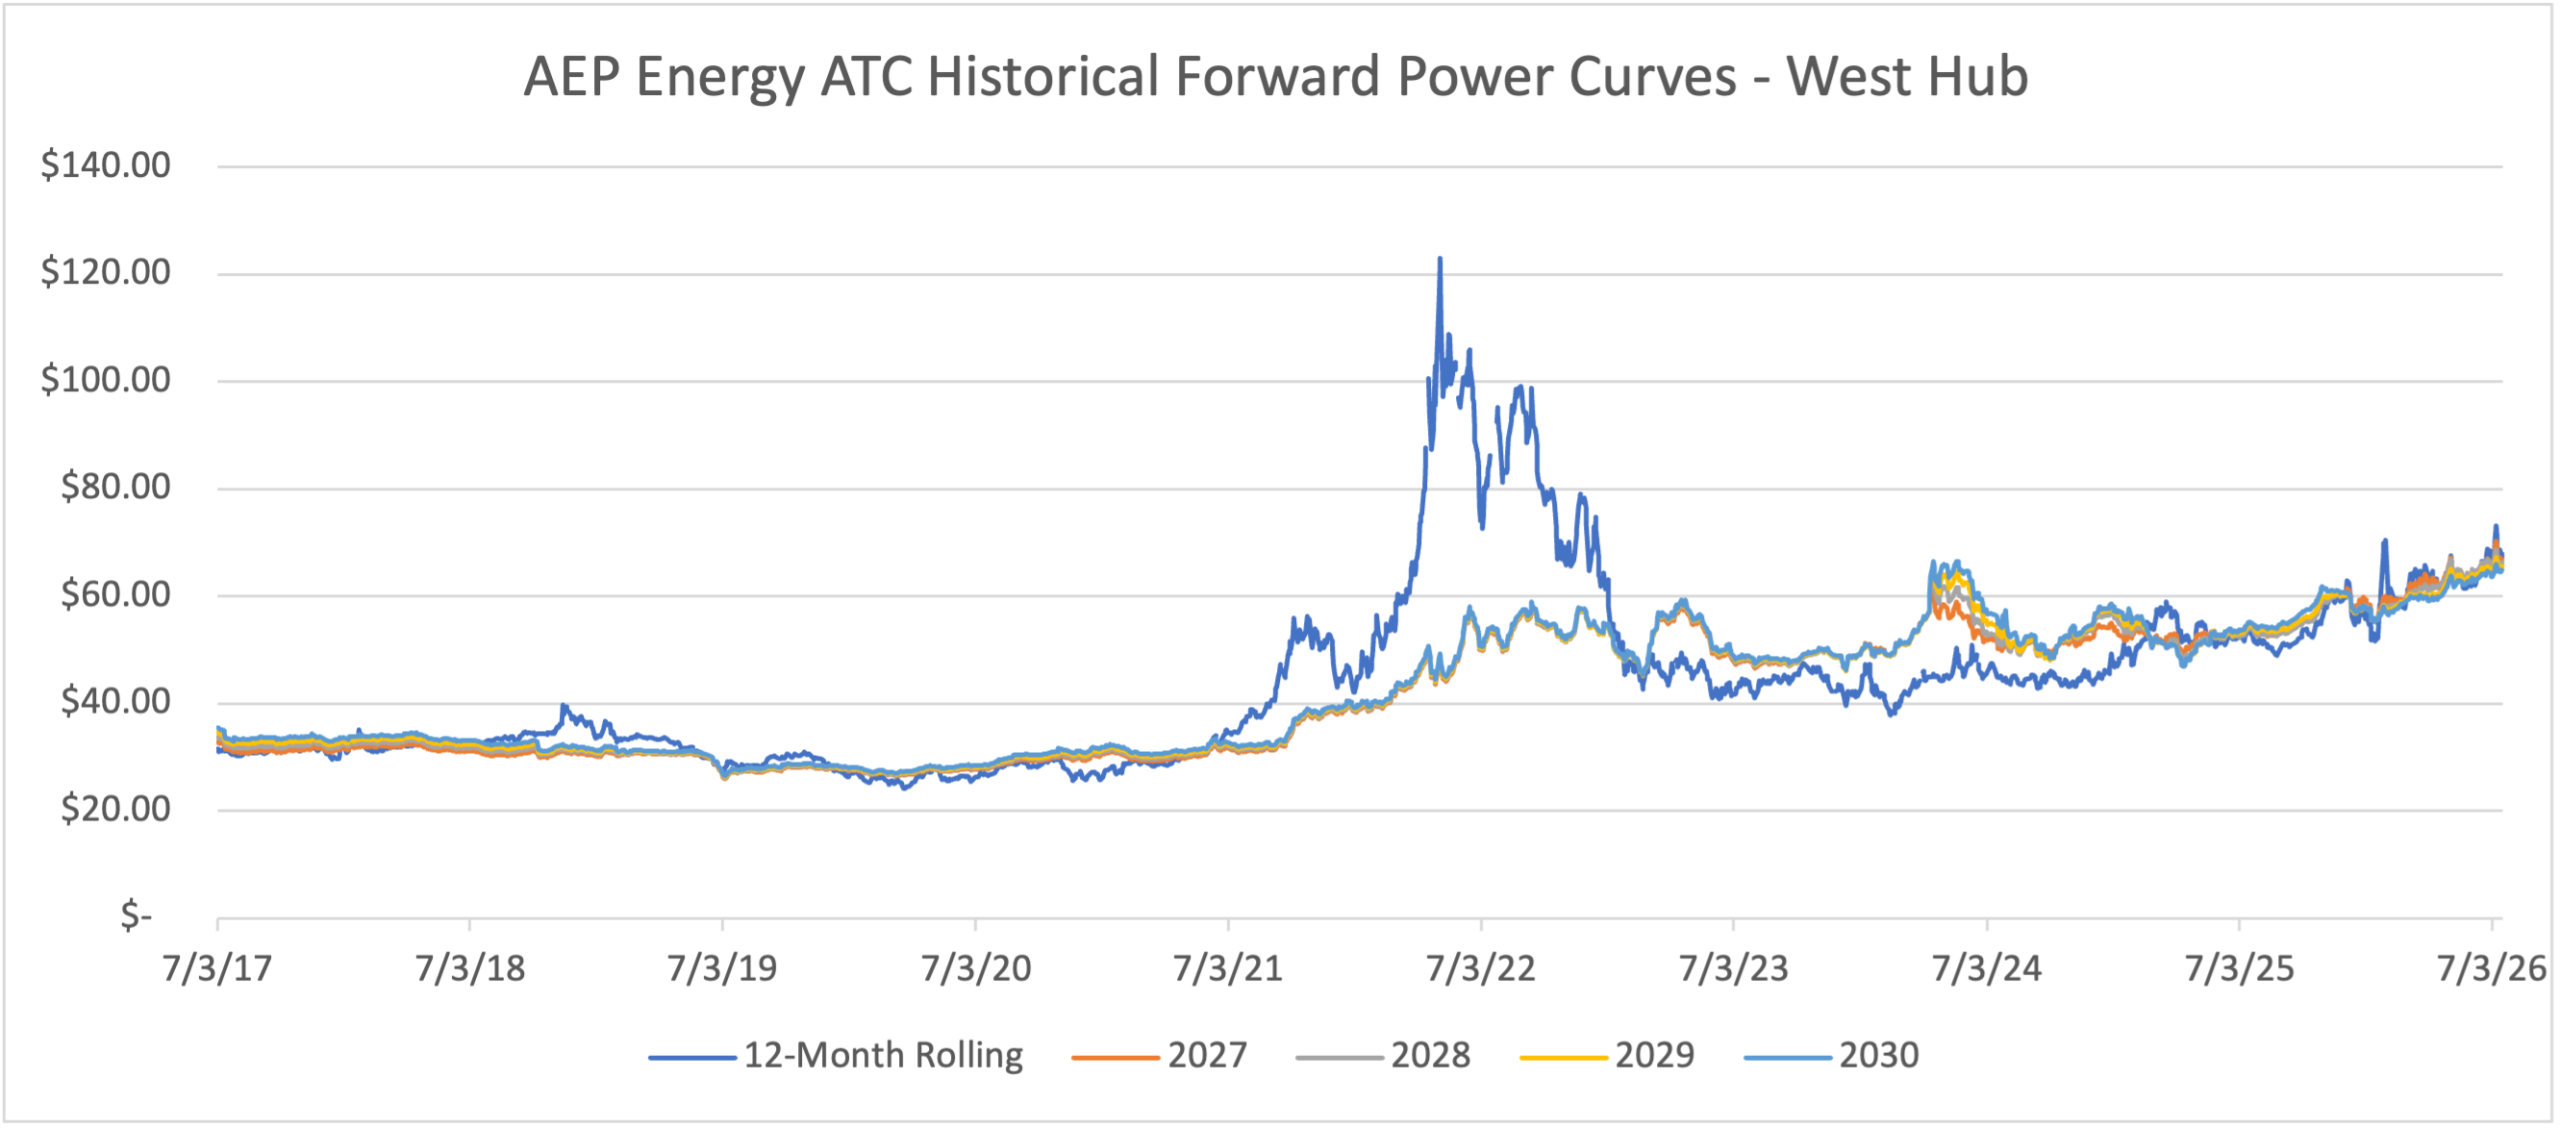
*Graph is for illustrative purposes only. West Hub priced in Eastern Standard Time (EST)
West Hub ATC Forward Price Trend Analysis
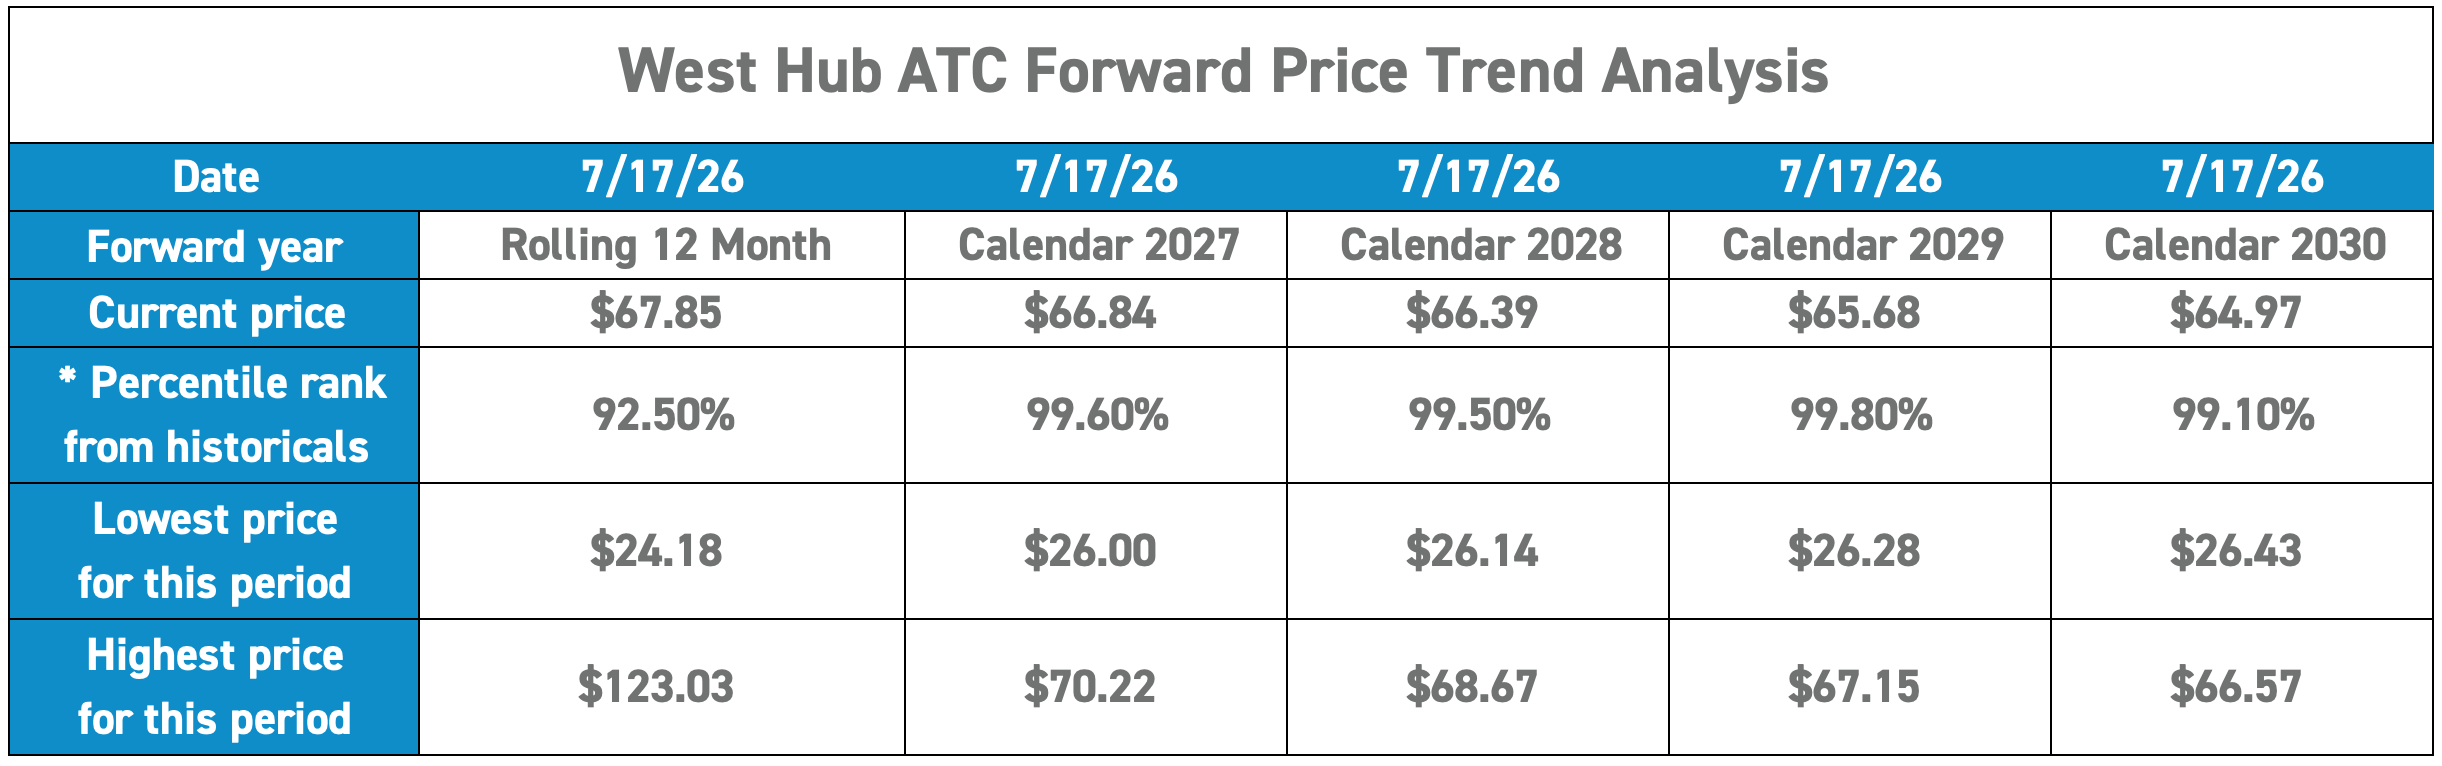
*Percentile rank from historicals represents the relation of current price and how it compares to historical pricing. For Calendar 2028, 99.5% indicates that the current price is lower than .5% of historical pricing dating back to July 2017.
Western (West) Hub On-Peak
Source: AEP Energy internal estimates
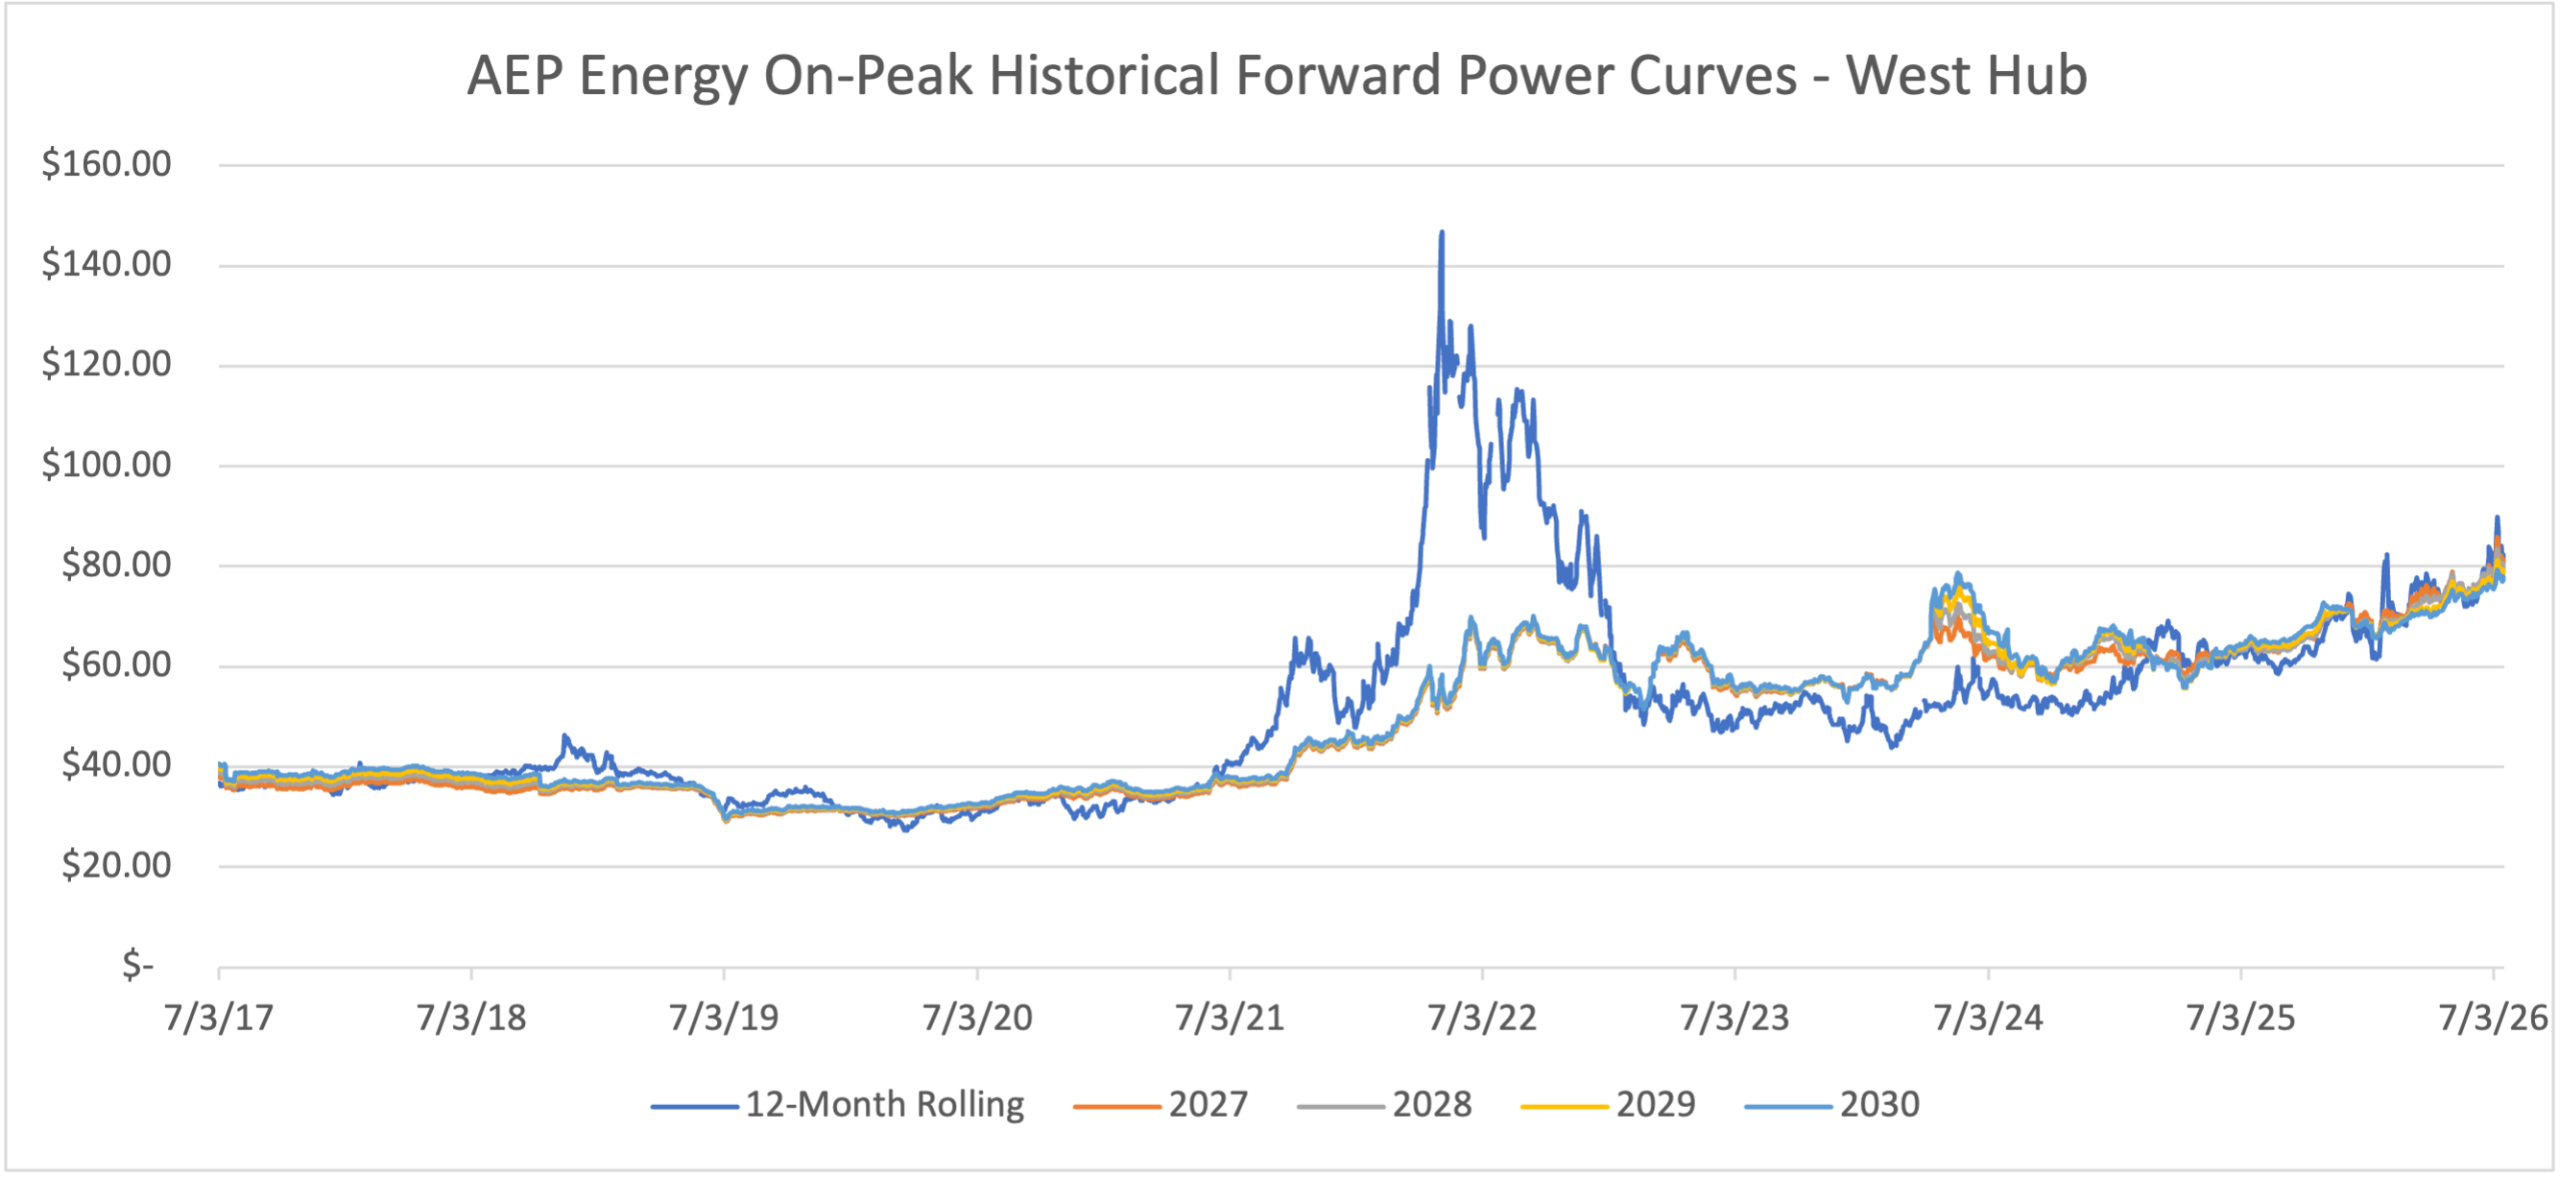
*Graph is for illustrative purposes only. West Hub priced in Eastern Standard Time (EST)
West Hub On-Peak Forward Price Trend Analysis
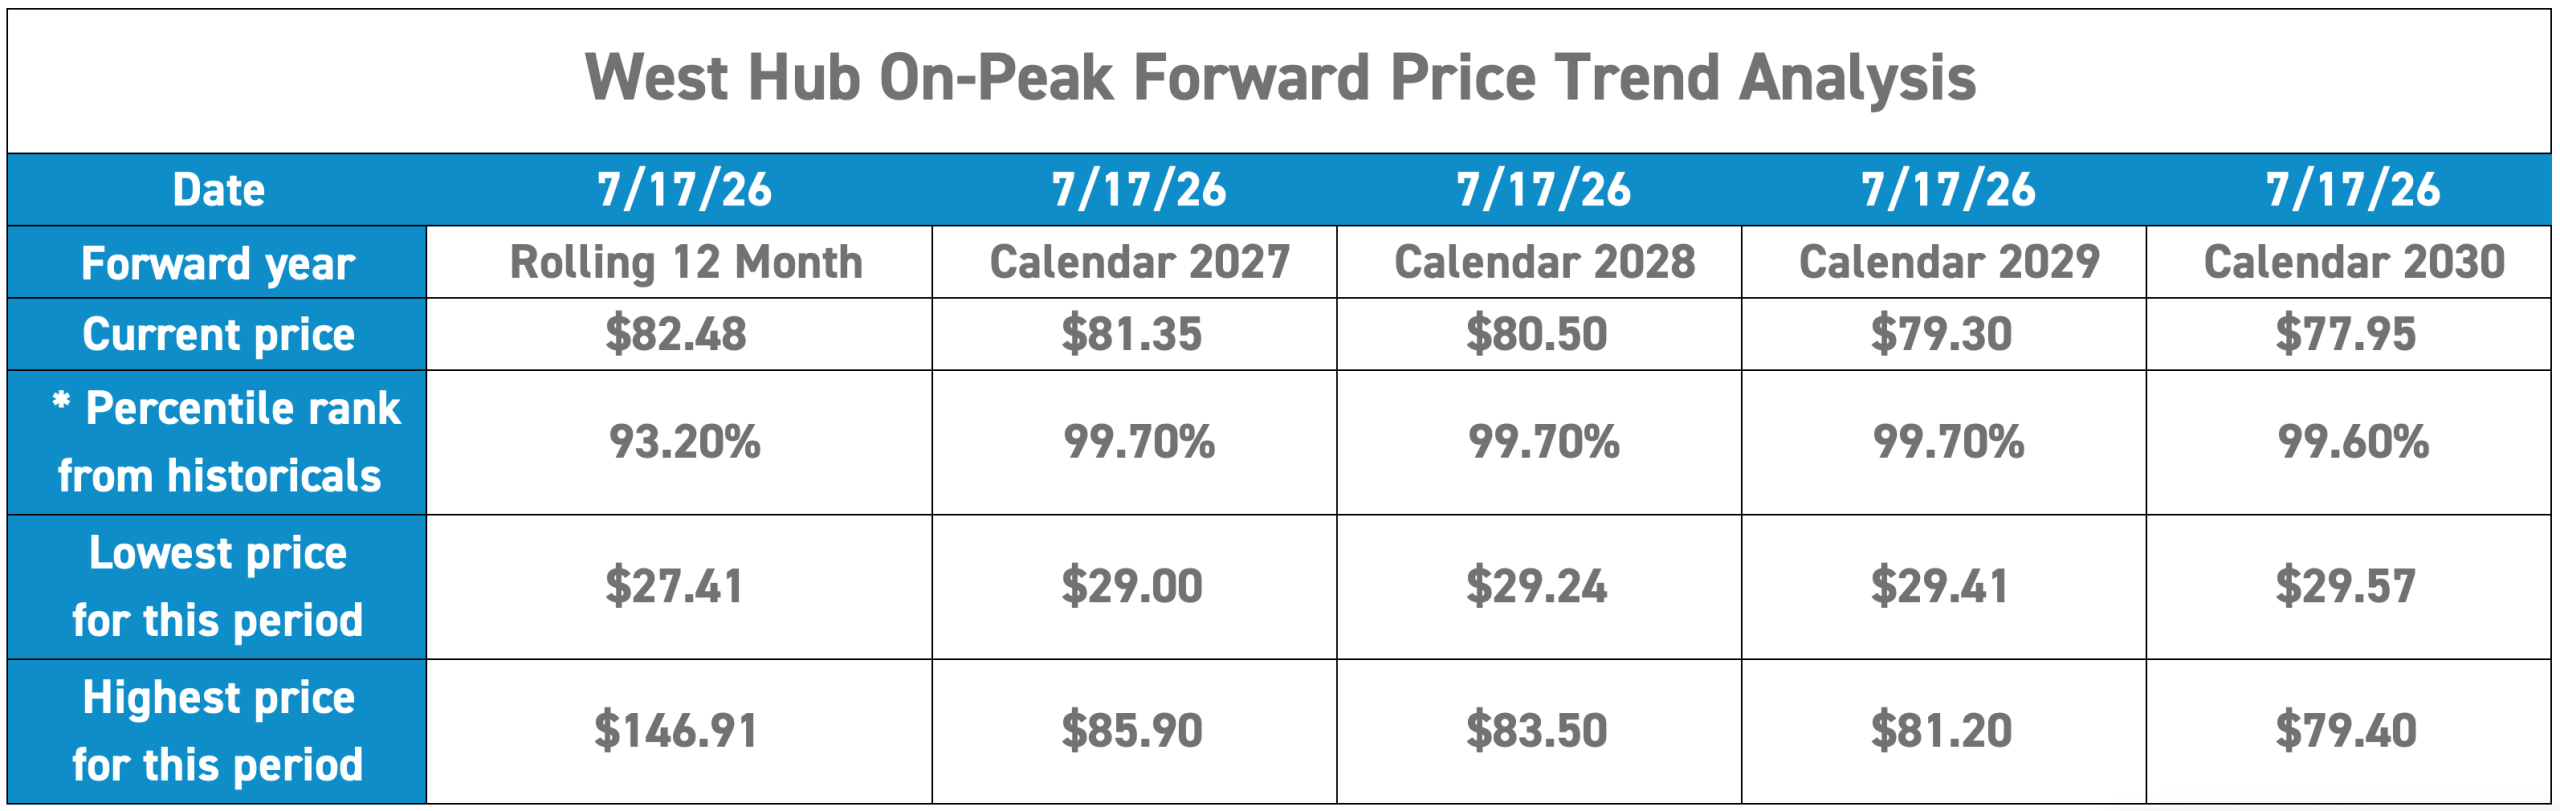
*Percentile rank from historicals represents the relation of current price and how it compares to historical pricing. For Calendar 2028, 99.7% indicates that the current price is lower than 0.3% of historical pricing dating back to July 2017.
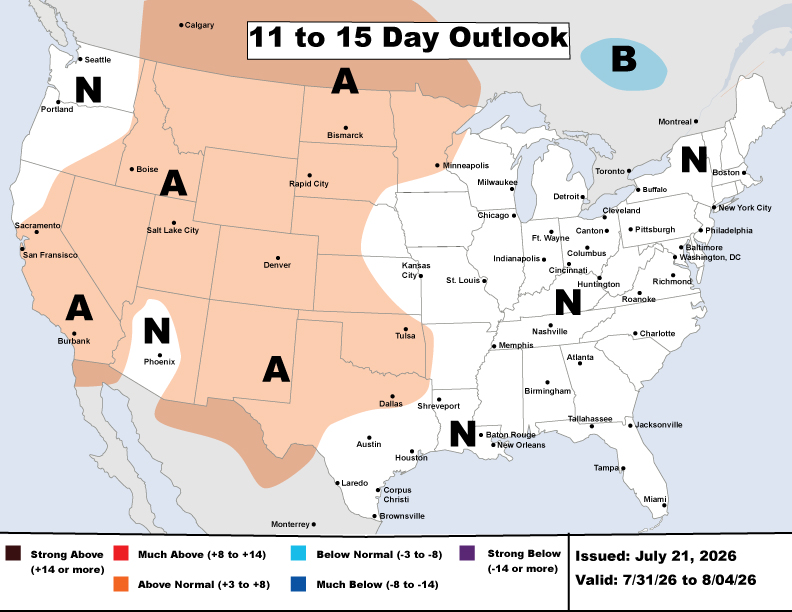
Weather
Source: AEP Energy Supply Meteorologist
Natural Gas Storage
Source: U.S. Energy Information Administration (EIA)
EIA Natural Gas Storage
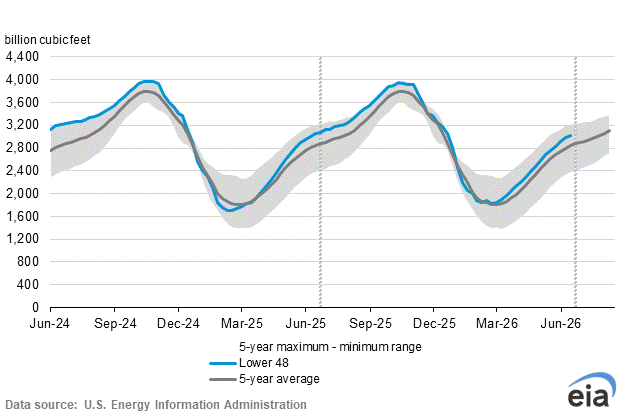
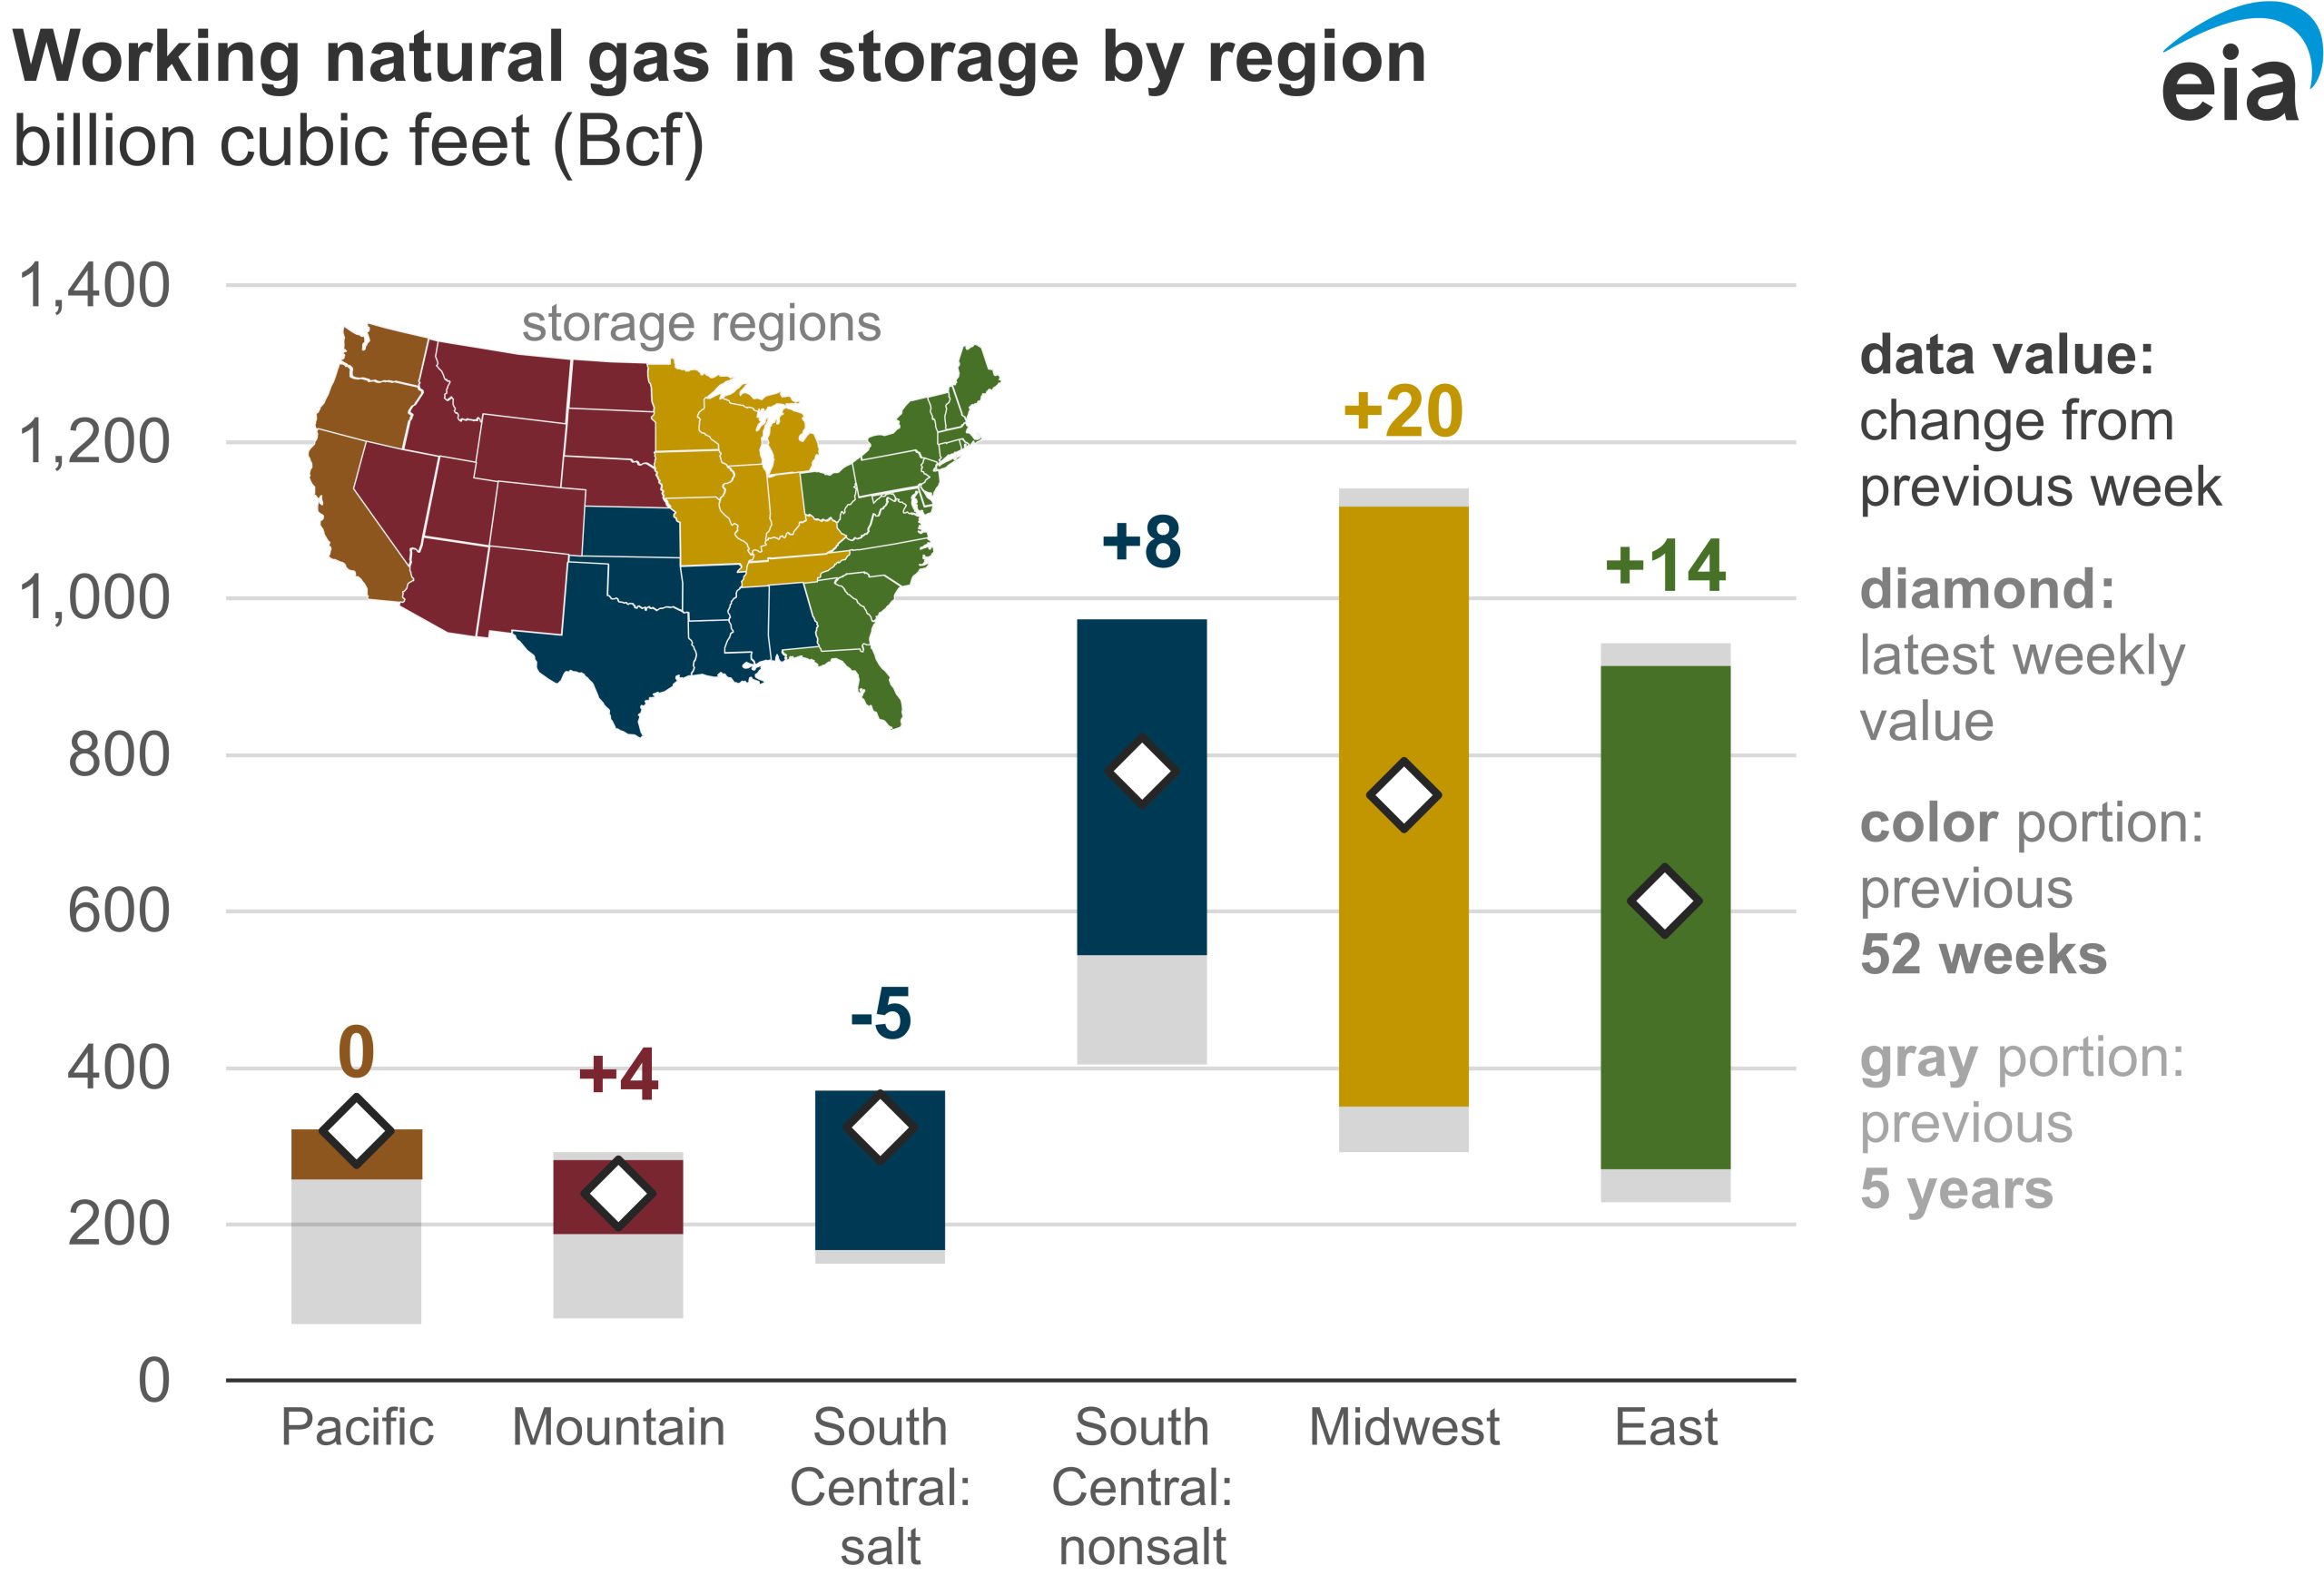
Working gas in storage was 3,024 Bcf as of Friday, July 10, 2026, according to EIA estimates. This represents a net increase of 41 Bcf from the previous week. Stocks were 21 Bcf less than last year at this time and 181 Bcf above the five-year average of 2,843 Bcf. At 3,024 Bcf, total working gas is within the five-year historical range.
AEP Energy does not guarantee the accuracy, timeliness, suitability, completeness, freedom from error, or value of any information herein. The information presented is provided “as is”, “as available”, and for informational purposes only, speaks only to events or circumstances on or before the date it is presented, and should not be construed as advice, a recommendation, or a guarantee of future results. AEP Energy disclaims any and all liabilities and warranties related hereto, including any obligation to update or correct the information herein. Summaries and website links included herein (collectively, “Links”) are not under AEP Energy’s control and are provided for reference only and not for commercial purposes. AEP Energy does not endorse or approve of the Links or related information and does not provide any warranty of any kind or nature related thereto. Forward-looking statements contained herein are based on forecasted or outlook information (including assumptions and estimations) but any such statements may be influenced by innumerable factors that could cause actual outcomes and results to be materially different from those anticipated. As such, these statements are subject to risks, uncertainties, fluctuating market conditions, and other factors that may cause actual results to differ materially from expectations and should not be relied upon. Whether or how the customer utilizes any such information is entirely its responsibility (for which it assumes the entire risk).