Transmission Congestion: How does this affect your energy price?
CommercialJun 5, 2018
May 2018 Edition: Transmission Congestion: How does this affect your energy price?
As an energy buyer, you may have heard terms such as Transmission Congestion, Marginal Losses, Financial Transmission Rights (FTRs), and Auction Revenue Rights (ARRs). In this edition, our experts will provide a high-level dive and how these components affect your energy price.
Let’s begin with understanding the origin of these terms, and that’s with PJM. PJM is the Regional Transmission Organization (RTO) responsible for coordinating the movement of wholesale electricity and ensuring reliability in Northeastern Illinois, Indiana, Kentucky, Delaware, Maryland, Michigan, New Jersey, North Carolina, Ohio, Pennsylvania, Tennessee, Virginia, West Virginia and the District of Columbia. PJM, an independent and neutral party, among their many duties, conducts market auctions, setting wholesale energy and capacity prices for generators, utilities, power marketers, and other market participants. You may be familiar with PJM’s term for price, which is called Locational Marginal Price (LMP). LMP is constructed from three components, which we will discuss further in this article. PJM is a nodal market, meaning it calculates a discrete LMP for each location, in its footprint. PJM’s large footprint contains thousands of locations. A location may be a generator, substation bus, or a collection of locations (PJM’s collections include zones, hubs, aggregates, and interfaces). Many factors feed into PJM’s Day-Ahead commitment model, which typically produces different LMPs for each location. PJM offers financial tools, namely FTRs and ARRs, which can mitigate some of the Day-Ahead locational price risk.
How is LMP computed?
Each day, PJM runs their Day-Ahead commitment model after generators submit their generation capabilities and costs (offers). At the same time, entities with energy demand submit their load bids to PJM. PJM applies the generation and load at their respective locations, and models the expected transmission grid topology for the next day. PJM then conducts an auction of sorts, where it satisfies load (plus a reserve margin) with the lowest cost generation available, regardless of utility boundaries. The result is a distinct price (LMP) for each location for each hour of the day.
What are the components of LMP?
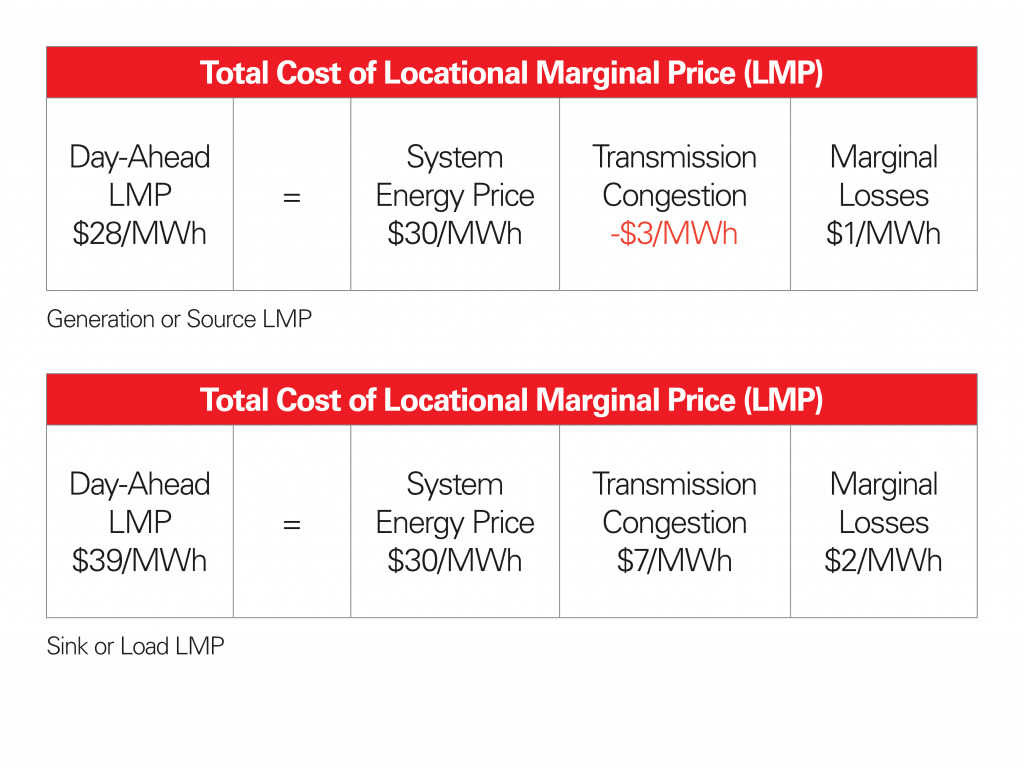
The LMP consists of three components: System Energy Price, Transmission Congestion, and Marginal Losses. The sum of these components is the LMP.
• System Energy Price: The System Energy Price is the same for all participants at each location in the footprint. A unique System Energy Price is determined for each hour. The System Energy Price is the pure price of energy if the Day-Ahead commitment were to match generation offers and load bids with no concerns for differences in physical locations or physical transmission constraints. Factors affecting the System Energy Price are generation available, cost of generation available, and demand from loads.
To help explain, here’s an example: Imagine a grid with four buses. Three of the buses have generators; the fourth bus is a load of 500 MW. Each of the three generators commits to producing 250 MW of electricity. Generator A has a cost of $25/MWh; Generator B has a cost of $30/MWh; and Generator C has a cost of $50/MWh. On a typical day, the System Energy Price is $30/MWh. Why $30? Recall the “M” in LMP. PJM determines the cost of the Marginal, or last and most expensive, generating unit required to meet the next day load commitment. In this example, that’s $30/MWh Generator B. Generator A ($25/MWh offer) gets paid $30/MWh, and Generator C ($50/MWh offer) is not selected, or committed, for the next day.
• Transmission Congestion: PJM defines Transmission Congestion as a condition that arises on the transmission system when one or more restrictions prevents the economic dispatch of electric energy from serving loads. Economic dispatch is meeting system demand at the lowest possible cost.
We illustrated above how the System Energy Price of LMP is determined. Now, let’s consider transmission congestion. Given the same scenario as above, we’ll continue the example by adding the fact the only transmission line from Generator A (the $25/MWh unit) to serve the load is out for maintenance. The $25/MWh unit is now re-dispatched to serve a different load. The 500 MW load will be now be served by Generator B at $30/MWh plus Generator C at $50/ MWh. The result is a total LMP of $50/MWh for the entire 500 MW load. Factoring in transmission grid restrictions, things quickly get more complicated, as LMPs paid to generators and charged to loads (LMPs at each location) now become different.
• The third component of LMP is Marginal Losses. Marginal Losses refer to the loss of energy in the transmission of electricity from generation resources to the end user, which is dissipated as heat through transformers, transmission lines, and other transmission facilities. The further power is transmitted over a transmission line the greater the losses. Like congestion, Marginal Losses contribute to LMP differences at each location in PJM.
Let’s dig deeper into Congestion
Perhaps you are a load serving entity, referred to as “load,” which has a generation resource. This resource could be physical, such as a generation facility, or a financial fixed price agreement. In this example, the generation resource has a different LMP location than the load. The load is subject to differences in LMP due to congestion and Marginal Losses. The value of the generation could be higher than the cost of the load which is referred to as negative congestion. The opposite could occur such as the value of the resource could be lower than the cost of the load which then is positive congestion. Positive congestion is typically a concern to a load serving entity which has a generation resource, as it lowers the generator’s revenue and increases the cost at the load bus.
Transmission Congestion can change on a daily basis due to changes in available generation and available transmission, and the resulting congestion can be either positive or negative. What can be done to mitigate congestion? PJM offers financial tools to hedge this congestion risk. One of these tools is Financial Transmission Rights. Financial Transmission Rights (FTRs) are financial instruments awarded to successful bidders in FTR auctions conducted by PJM. An FTR entitles the holder to a stream of revenues (or charges) based on the hourly Day-Ahead congestion price differences between two locations. The two locations that make up an FTR are called a “source” and a “sink.” A source/sink pair are sometimes referred to as a “path.” PJM conducts long term (up to three years), annual, and monthly FTR auctions. A market participant can bid to buy an FTR to hedge the congestion portion of the LMP difference they may be seeing between their generation and their load.
How do FTRs work?
As we begin to explain FTRs, let’s begin by illustrating the LMP difference between the two points; a generator, which we’ll call the source, and a load bus, zone, or aggregate, which we’ll call the sink.
As the market participant, the sink or load serving entity owns a 100 MW FTR. The credit from the FTR is 100 MW multiplied by ($7-(-$3)) = $1,000. Notice the FTR credit covers only congestion and not the total difference in LMP between the points; generation and sink. So how are FTRs acquired? As mentioned previously, market participants acquire FTR’s by bidding into auctions run by PJM. The cost of the FTR may exceed the cost of congestion in some cases, in other cases the FTR may be less than the cost of congestion. There are many factors such as demand patterns, transmission outages, generation costs, and generation outages that can affect congestion and ultimately the value or cost of an FTR.
Are FTRs the only tool available to mitigate congestion?
Auction Revenue Rights (ARRs) are another tool provided by PJM. ARRs provide a revenue stream to firm transmission customers to offset the purchase price of FTRs. ARRs are allocated annually to owners of firm transmission. The holder of the ARR can choose to receive a credit from PJM or to convert the ARR into FTR, referred to as self-scheduling ARRs. If the owner takes the ARR credit but does not purchase an FTR, they are then exposed to the congestion portion of the LMP. The allocation of ARR credits is complex and the credits may not always be available.
What impact does this have on a retail energy customer?
Many factors influence your retail energy price on a daily basis. During the course of our monthly Customer Insights publications, we’ve addressed the impact weather and natural gas has on retail energy prices. Now we’ve provide you with a behind-the-scenes look at the first step to arriving at the pure wholesale energy price to give you a better understanding of the complexity of the daily market.
In discussing Transmission Congestion and associated FTRs and ARRs, we have really only scratched the surface of what is a very involved and complex topic. To learn more or to answer questions you may have, speak with your AEP Energy advisor
Market Overview – AEP Energy Trading
Natural Gas
• During the month of April, natural gas prices were mixed, while power prices were stronger throughout the curve.
• Prompt month (May 2018) natural gas at Henry Hub was up $0.030/MMBtu to close at $2.763/MMBtu.
• Balance of the year (June – December 2018) was up $0.039/ MMBtu to $2.823/MMBtu.
• Further out the curve, Calendar 2019 was off $0.071/MMBtu to $2.720/MMBtu, and Calendar 2020 was off $0.072/MMBtu to $2.703/MMBtu. Power PJM – Ohio
• Power, on the other hand, pushed higher throughout the curve as heavy outages and below normal temperatures during the month of April resulted in robust liquidations.
• April 2018 on peak AEP – Dayton Hub liquidated over $40.00/ MWh, which was almost $5.00/MWh higher from where the market was trading at the end of March.
• This strength reverberated throughout the curve as May 2018 was up $3.35/MWh to $38.75/MWh, and June 2018 was up $0.85/MWh to $35.55/MWh.
• Balance of the year (June – December 2018) climbed $0.58/ MWh to $36.06/MWh.
• In the calendar years, 2019 was up $0.53/MWh to $35.22/ MWh and 2020 was up $0.22/MWh to $34.59/MWh. Power Illinois
• PJM ComEd zone April 2018 day-ahead peak power climbed $4.08/MWh closing the month at $32.30/MWh.
• MISO Illinois.Hub April 2018 day-ahead peak power increased significantly by $7.90/MWh to $34.45/MWh.
• Cold weather patterns continued through Illinois during April attributing to increased power prices.
Any references made to prompt month natural gas will normally be associated with a range starting the first day of the month through the final settlement of the respective prompt month natural gas contract. Other references to forward natural gas prices and all power prices will be based on a range starting the first day of the month through the final day of the month.
AEP Energy does not guarantee the accuracy, timeliness, suitability, completeness, freedom from error, or value of any information herein. The information presented is provided “as is”, “as available”, and for informational purposes only, speaks only to events or circumstances on or before the date it is presented, and should not be construed as advice, a recommendation, or a guarantee of future results. AEP Energy disclaims any and all liabilities and warranties related hereto, including any obligation to update or correct the information herein. Summaries and website links included herein (collectively, “Links”) are not under AEP Energy’s control and are provided for reference only and not for commercial purposes. AEP Energy does not endorse or approve of the Links or related information and does not provide any warranty of any kind or nature related thereto.
(2 minute read) Stakeholder demands for sustainability and decarbonization are driving the need for companies to meet emission reduction targets. Are you challenged by how to successfully meet your goals, while also balancing cost and reliability? Building a decarbonization roadmap gives you a step-by-step process to manage roadblocks and meet greenhouse gas emission reduction targets. …
(2 minute read) Transmission Rates Keep Climbing Have you noticed the transmission rate on your energy bill increasing recently? You are not imagining things. In some areas, rates have increased over 75%! Regardless of whether transmission costs are billed by the utility or passed through to you on your retail energy supplier bill, this costly …
Enter your zip code to see energy plans in your area
Already an AEP energy customer?Login to view account details or enroll at the same rate as new customers.
We found several utilities in your area! Please select yours below:
AEP Energy Reward Store is filled with a variety of energy-saving products for your home. It is a simple and convenient way for you to shop for items to make your home more energy efficient while saving you time and money.
Collect Reward Dollars each month ($5/electric, $3/natural gas) for simply being an AEP Energy Customer.
Shop AEP Energy Reward Store for energy-efficient products like smart thermostats, LED lighting, and more.
Redeem your accumulated Reward Dollars and enjoy smart solutions for your home.
We're Sorry
Brandi Nye, Managing Director of Business Solutions
Brandi is an expert in her field with professional experience in the sustainability industry. Not only does Brandi have solid base knowledge, but she continues to grow her acumen through various learning and development experiences. Brandi is a creative and thoughtful utility professional with expertise in regulatory and utility operations.